OPEN-SOURCE SCRIPT
업데이트됨 TI65
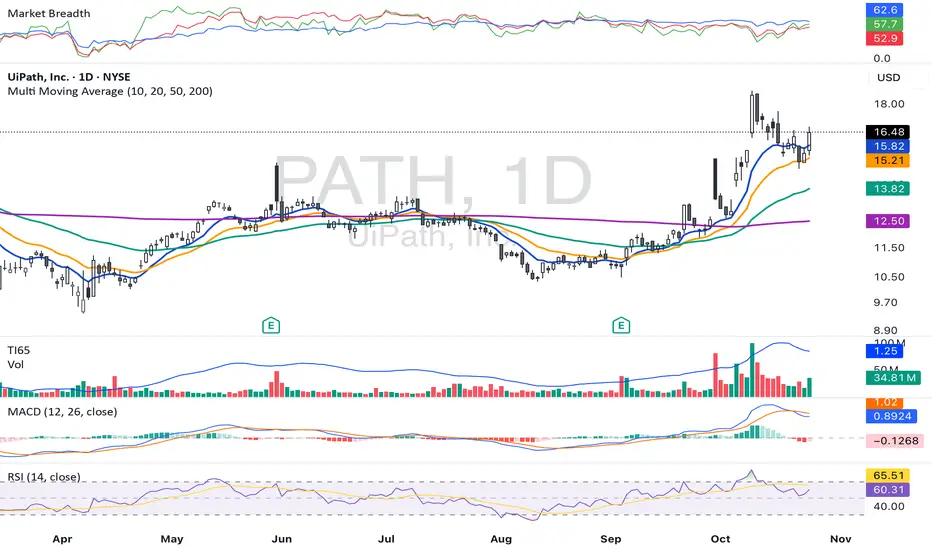
**TI65 (Trend Intensity 65)** is a technical indicator designed to measure the strength and momentum of a trend over two distinct periods. It compares a short-term 7-period simple moving average (SMA) with a long-term 65-period SMA, producing a ratio that helps traders identify shifts in market momentum and trend direction.
- When the **TI65 value is greater than 1**, it indicates that the short-term moving average is above the long-term average, suggesting increasing momentum and a potentially bullish trend.
- When the **TI65 value drops below 1**, it signals weakening short-term momentum relative to the longer-term trend, often interpreted as a bearish or consolidating phase.
This indicator can be applied to both price and volume data, making it useful for identifying periods of strong volume surges or price movements. By observing changes in the TI65 ratio, traders can pinpoint low-risk entry points for trend-following strategies and quickly recognize periods of market transition.
TI65 is commonly used by momentum and breakout traders for screening strong candidates and confirming the sustainability of ongoing trends. It is simple, effective, and easily implemented via custom scripts on popular platforms like TradingView.
릴리즈 노트
Replaced original TI65 (7-period SMA / 65-period SMA) with a faster, more responsive variant: TI60 (8-period SMA / 60-period SMA). This adjustment shortens the long-term reference from ~3 months to ~2.5 months, increasing sensitivity to early trend shifts — ideal for volatile assets like MSOS.
Thresholds refined: bullish above 1.08, bearish below 0.92. TI60 line now overlays the volume subplot for direct price-momentum vs. liquidity comparison.
오픈 소스 스크립트
트레이딩뷰의 진정한 정신에 따라, 이 스크립트의 작성자는 이를 오픈소스로 공개하여 트레이더들이 기능을 검토하고 검증할 수 있도록 했습니다. 작성자에게 찬사를 보냅니다! 이 코드는 무료로 사용할 수 있지만, 코드를 재게시하는 경우 하우스 룰이 적용된다는 점을 기억하세요.
면책사항
해당 정보와 게시물은 금융, 투자, 트레이딩 또는 기타 유형의 조언이나 권장 사항으로 간주되지 않으며, 트레이딩뷰에서 제공하거나 보증하는 것이 아닙니다. 자세한 내용은 이용 약관을 참조하세요.
오픈 소스 스크립트
트레이딩뷰의 진정한 정신에 따라, 이 스크립트의 작성자는 이를 오픈소스로 공개하여 트레이더들이 기능을 검토하고 검증할 수 있도록 했습니다. 작성자에게 찬사를 보냅니다! 이 코드는 무료로 사용할 수 있지만, 코드를 재게시하는 경우 하우스 룰이 적용된다는 점을 기억하세요.
면책사항
해당 정보와 게시물은 금융, 투자, 트레이딩 또는 기타 유형의 조언이나 권장 사항으로 간주되지 않으며, 트레이딩뷰에서 제공하거나 보증하는 것이 아닙니다. 자세한 내용은 이용 약관을 참조하세요.