PROTECTED SOURCE SCRIPT
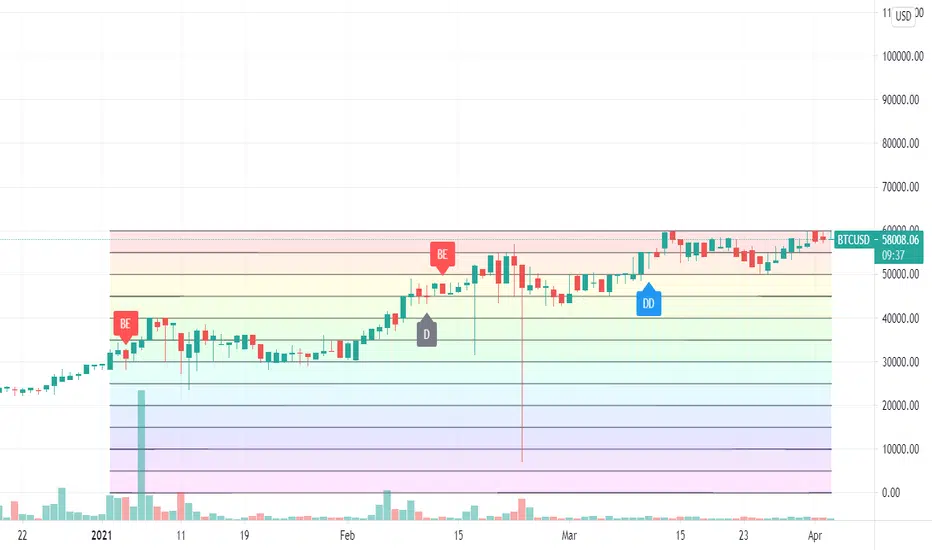
Horizontal Line Pattern (adj #of lines, color, timeframe, top)

The simple script allows you to subdivide and price range into a number of equal segments. For example, you can divide 50,000 to 60,000 into 2,4, or 7 lines. You can also set the beginning date and the end date. This can be useful as prices tend to hover around whole numbers or ratios of whole numbers.
You must use settings to set the number of lines and the start and end dates. You can also change the line thickness and the color scheme.
You must use settings to set the number of lines and the start and end dates. You can also change the line thickness and the color scheme.
보호된 스크립트입니다
이 스크립트는 비공개 소스로 게시됩니다. 하지만 이를 자유롭게 제한 없이 사용할 수 있습니다 – 자세한 내용은 여기에서 확인하세요.
면책사항
해당 정보와 게시물은 금융, 투자, 트레이딩 또는 기타 유형의 조언이나 권장 사항으로 간주되지 않으며, 트레이딩뷰에서 제공하거나 보증하는 것이 아닙니다. 자세한 내용은 이용 약관을 참조하세요.
보호된 스크립트입니다
이 스크립트는 비공개 소스로 게시됩니다. 하지만 이를 자유롭게 제한 없이 사용할 수 있습니다 – 자세한 내용은 여기에서 확인하세요.
면책사항
해당 정보와 게시물은 금융, 투자, 트레이딩 또는 기타 유형의 조언이나 권장 사항으로 간주되지 않으며, 트레이딩뷰에서 제공하거나 보증하는 것이 아닙니다. 자세한 내용은 이용 약관을 참조하세요.