OPEN-SOURCE SCRIPT
업데이트됨 Improved Weinstein Stage Analysis
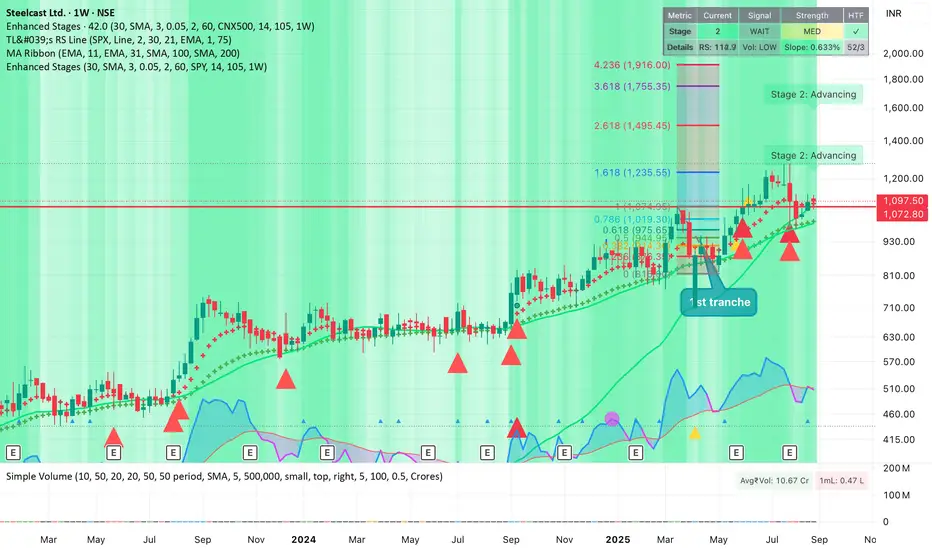
The code provides an actionable, disciplined, and visually informative implementation of the “Stage Analysis” approach pioneered by Stan Weinstein, with enhancements to modernize, automate, and clarify the methodology for today’s traders using TradingView. It faithfully follows the workflow recommended: identify long-term cycles, confirm with volume and relative strength, and only engage aggressively with the market during the advancing (bullish) stage with all “clues” aligned.
릴리즈 노트
Key Enhancements Implemented1. Advanced Stage Logic
Percentage-based MA slope calculation for better sensitivity
Multi-condition stage determination with improved accuracy
Dynamic confirmation system to reduce false signals
2. Sophisticated Volume Analysis
Multi-period volume averages (20 & 50 SMA)
Percentile ranking for context-aware volume spikes
Separate strong vs moderate volume classifications
3. Enhanced Relative Strength
Improved error handling for security data
Momentum-based RS strength detection
Customizable outperformance thresholds
4. Multi-Timeframe Support
Optional higher timeframe confirmation
Stage alignment validation
Visual indicators for timeframe conflicts
5. Advanced Visual Features
Dynamic transparency based on trend strength
Enhanced color coding system
Comprehensive information table with signal strength scoring
6. Improved Alert System
Multi-condition signal validation
Strength-based alert prioritization
Detailed alert messages with context
This enhanced version provides significantly more robust signal generation while maintaining the core Weinstein methodology principles.
릴리즈 노트
minor updates릴리즈 노트
***
**Major Updates in This Release:**
1. **User-Selectable Colors for All Stages and Visual Elements**
- New color picker inputs allow users to personalize stage background, moving average, signal, table, and relative strength colors directly from the indicator settings, reflecting instantly on the chart.
- All main visual elements (stage backgrounds, MA lines, volume spike markers, RS plots/lines, table highlights, and labels) are now controlled via these inputs instead of fixed colors.
2. **Visual Consistency and Custom Brandability**
- Default color scheme remains unchanged for existing users, ensuring a seamless upgrade.
- Visual elements for different Weinstein stages, volume events, and table rows/colors can now be adapted for visual accessibility or organizational branding.
3. **Table and Label Color Enhancement**
- Informational table and on-chart labels reflect user-selected colors for:
- Stage highlights
- Signal (BUY/SELL/WAIT)
- Strength levels (LOW/MED/HIGH)
- Volume, RS, MA slope, and HTF alignment
4. **Improved Table Rendering Logic**
- Ensured no duplicate or overwritten cells; every table cell contains distinct, context-relevant content with the correct custom background color.
- Enhanced readability and clarity for table data with dynamic color backgrounds.
5. **Cleaner, Modular Code Structure**
- Grouped all color settings at the top for easy maintenance.
- All color assignments in the plotting and table logic now reference input variables, centralizing customizability.
***
오픈 소스 스크립트
트레이딩뷰의 진정한 정신에 따라, 이 스크립트의 작성자는 이를 오픈소스로 공개하여 트레이더들이 기능을 검토하고 검증할 수 있도록 했습니다. 작성자에게 찬사를 보냅니다! 이 코드는 무료로 사용할 수 있지만, 코드를 재게시하는 경우 하우스 룰이 적용된다는 점을 기억하세요.
면책사항
해당 정보와 게시물은 금융, 투자, 트레이딩 또는 기타 유형의 조언이나 권장 사항으로 간주되지 않으며, 트레이딩뷰에서 제공하거나 보증하는 것이 아닙니다. 자세한 내용은 이용 약관을 참조하세요.
오픈 소스 스크립트
트레이딩뷰의 진정한 정신에 따라, 이 스크립트의 작성자는 이를 오픈소스로 공개하여 트레이더들이 기능을 검토하고 검증할 수 있도록 했습니다. 작성자에게 찬사를 보냅니다! 이 코드는 무료로 사용할 수 있지만, 코드를 재게시하는 경우 하우스 룰이 적용된다는 점을 기억하세요.
면책사항
해당 정보와 게시물은 금융, 투자, 트레이딩 또는 기타 유형의 조언이나 권장 사항으로 간주되지 않으며, 트레이딩뷰에서 제공하거나 보증하는 것이 아닙니다. 자세한 내용은 이용 약관을 참조하세요.