OPEN-SOURCE SCRIPT
업데이트됨 ADX W. Wilders(DI+, DI-, DX, ADXR, Equilibrium Point)
The reason for publishing the script was the lack of display of important components in the standard ADX indicator, such as DI+, DI-, DX , ADXR, and the absence of a choice of methods for calculating moving averages in the indicator.
According to the book by the author of the ADX indicator, W. Wilder, the indicator components were calculated using the SMA formula, however, the RMA moving average is used in the code of the built-in indicator in TradingView, which shows excellent results, but this is not a classic calculation method. In addition to SMA and RMA, there are also EMA , HMA , WMA , VWMA moving averages to choose from. Added the ability to display lines ADX , ADXR , DX , DI+, DI- and Equilibrium points (when DI+ and DI- are equal or intersect).
ADX Trading Rules
1. Trade the intersections of DI+ and DI-
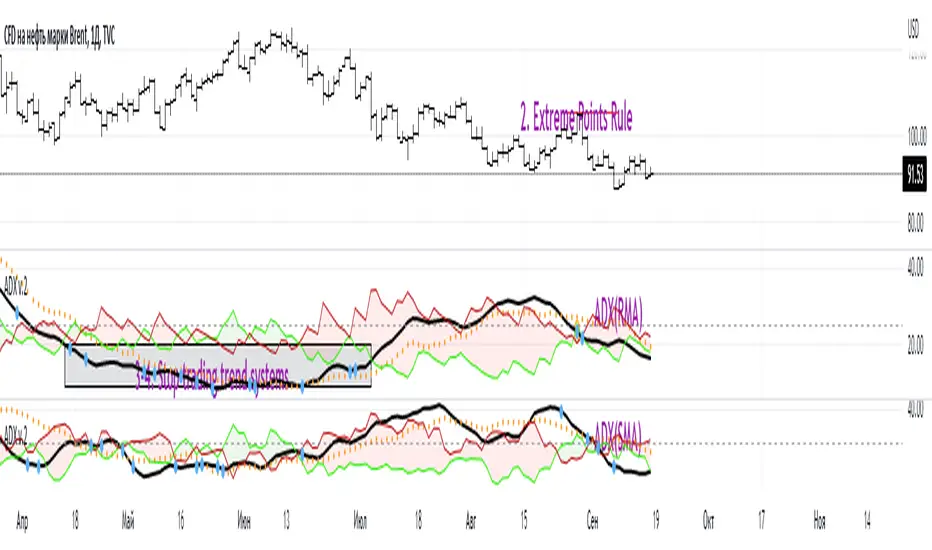
2. Extreme Point Rule(EPR). EPR is formed when DI+, DI- (Equilibrium point) crosses, forming a trend reversal point at the extremum of the current bar. In the example on the ADX RMA chart, the DI- line is above DI+. Being in a short position at the reverse intersection of the DI- and DI + lines, it is necessary to take the high price of the crossing bar for the reversal point, upon breakdown of which, turn to long. In this example, the breakdown did not take place and the short position remained active, despite the intersection of the DI+ lines over DI-. This rule is an excellent filter that removes unnecessary transactions in the trading system.
3. DI+ > ADX and DI- > ADX. Stop trading trend-following systems.
4. If ADXR > 25, the trading system will be profitable. With ADXR < 20, trend-following systems need to stop trading. Many mistakenly use ADX values instead of ADXR . The author explicitly pointed to ADXR in his book.
5. Equilibrium Point - balance points. The accumulation of these points on the chart means the presence of a flat in the market. Accumulation often appears on a declining ADX after a top has been established on the ADX indicator. The smaller the distance between the points, the less significant movements occurred in the market.
6. For intraday trading of cryptocurrencies use can the following ADX settings:
DI Length = 100
ADX Smoothing = 14
MA Type = VWMA
Flat Zone = 30
P.S. Fragment from an interview with W. Wilder:
OH: You are probably best known for inventing the Relative Strength Index ( RSI ), Average Directional Index ( ADX ) and Average True Range (ATR). Which of these is the most powerful tool for a trader?
WW: The ADX .
OH: Is it the indicator you are most proud of?
WW: I guess so.
According to the book by the author of the ADX indicator, W. Wilder, the indicator components were calculated using the SMA formula, however, the RMA moving average is used in the code of the built-in indicator in TradingView, which shows excellent results, but this is not a classic calculation method. In addition to SMA and RMA, there are also EMA , HMA , WMA , VWMA moving averages to choose from. Added the ability to display lines ADX , ADXR , DX , DI+, DI- and Equilibrium points (when DI+ and DI- are equal or intersect).
ADX Trading Rules
1. Trade the intersections of DI+ and DI-
2. Extreme Point Rule(EPR). EPR is formed when DI+, DI- (Equilibrium point) crosses, forming a trend reversal point at the extremum of the current bar. In the example on the ADX RMA chart, the DI- line is above DI+. Being in a short position at the reverse intersection of the DI- and DI + lines, it is necessary to take the high price of the crossing bar for the reversal point, upon breakdown of which, turn to long. In this example, the breakdown did not take place and the short position remained active, despite the intersection of the DI+ lines over DI-. This rule is an excellent filter that removes unnecessary transactions in the trading system.
3. DI+ > ADX and DI- > ADX. Stop trading trend-following systems.
4. If ADXR > 25, the trading system will be profitable. With ADXR < 20, trend-following systems need to stop trading. Many mistakenly use ADX values instead of ADXR . The author explicitly pointed to ADXR in his book.
5. Equilibrium Point - balance points. The accumulation of these points on the chart means the presence of a flat in the market. Accumulation often appears on a declining ADX after a top has been established on the ADX indicator. The smaller the distance between the points, the less significant movements occurred in the market.
6. For intraday trading of cryptocurrencies use can the following ADX settings:
DI Length = 100
ADX Smoothing = 14
MA Type = VWMA
Flat Zone = 30
P.S. Fragment from an interview with W. Wilder:
OH: You are probably best known for inventing the Relative Strength Index ( RSI ), Average Directional Index ( ADX ) and Average True Range (ATR). Which of these is the most powerful tool for a trader?
WW: The ADX .
OH: Is it the indicator you are most proud of?
WW: I guess so.
릴리즈 노트
Show everything by default오픈 소스 스크립트
트레이딩뷰의 진정한 정신에 따라, 이 스크립트의 작성자는 이를 오픈소스로 공개하여 트레이더들이 기능을 검토하고 검증할 수 있도록 했습니다. 작성자에게 찬사를 보냅니다! 이 코드는 무료로 사용할 수 있지만, 코드를 재게시하는 경우 하우스 룰이 적용된다는 점을 기억하세요.
면책사항
해당 정보와 게시물은 금융, 투자, 트레이딩 또는 기타 유형의 조언이나 권장 사항으로 간주되지 않으며, 트레이딩뷰에서 제공하거나 보증하는 것이 아닙니다. 자세한 내용은 이용 약관을 참조하세요.
오픈 소스 스크립트
트레이딩뷰의 진정한 정신에 따라, 이 스크립트의 작성자는 이를 오픈소스로 공개하여 트레이더들이 기능을 검토하고 검증할 수 있도록 했습니다. 작성자에게 찬사를 보냅니다! 이 코드는 무료로 사용할 수 있지만, 코드를 재게시하는 경우 하우스 룰이 적용된다는 점을 기억하세요.
면책사항
해당 정보와 게시물은 금융, 투자, 트레이딩 또는 기타 유형의 조언이나 권장 사항으로 간주되지 않으며, 트레이딩뷰에서 제공하거나 보증하는 것이 아닙니다. 자세한 내용은 이용 약관을 참조하세요.