OPEN-SOURCE SCRIPT
RSI Rate of Change (ROC of RSI)

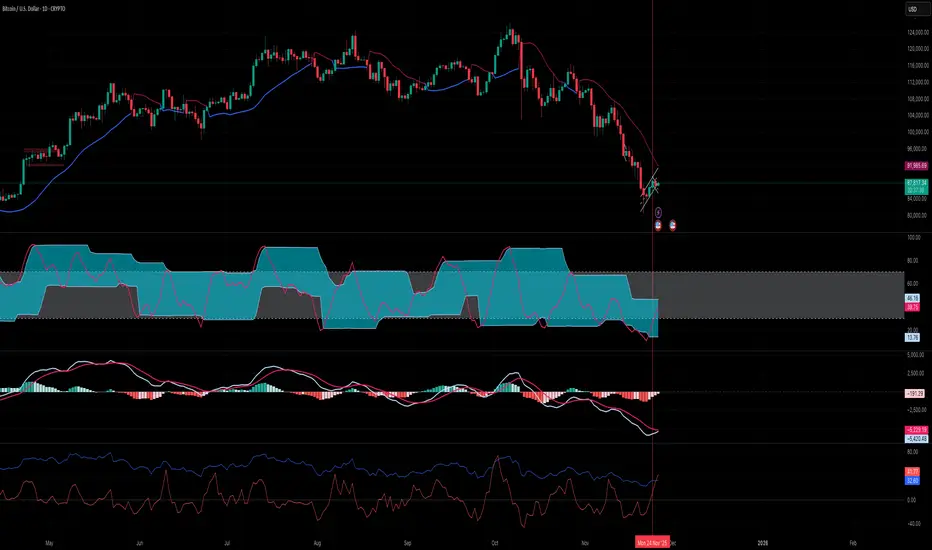
The RSI Rate of Change (ROC of RSI) indicator measures the speed and momentum of changes in the RSI, helping traders identify early trend shifts, strength of price moves, and potential reversals before they appear on the standard RSI.
While RSI shows overbought and oversold conditions, the ROC of RSI reveals how fast RSI itself is rising or falling, offering a deeper view of market momentum.
How the Indicator Works
1. RSI Calculation
The indicator first calculates the classic Relative Strength Index (RSI) using the selected length (default 14). This measures the strength of recent price movements.
2. Rate of Change (ROC) of RSI
Next, it computes the Rate of Change (ROC) of the RSI over a user-defined period.
This shows:
Positive ROC → RSI increasing quickly → strong bullish momentum
Negative ROC → RSI decreasing quickly → strong bearish momentum
ROC crossing above/below 0 → potential early trend shift
What You See on the Chart
Blue Line: RSI
Red Line: ROC of RSI
Grey dotted Zero Line: Momentum reference
Why Traders Use It
The RSI ROC helps you:
Detect momentum reversals early
Spot bullish and bearish accelerations not visible on RSI alone
Identify exhaustion points before RSI reaches extremes
Improve entry/exit precision in trend and swing trading
Validate price breakouts or breakdowns with momentum confirmation
Best For
Swing traders
Momentum traders
Reversal traders
Trend-following systems needing early confirmation signals
오픈 소스 스크립트
트레이딩뷰의 진정한 정신에 따라, 이 스크립트의 작성자는 이를 오픈소스로 공개하여 트레이더들이 기능을 검토하고 검증할 수 있도록 했습니다. 작성자에게 찬사를 보냅니다! 이 코드는 무료로 사용할 수 있지만, 코드를 재게시하는 경우 하우스 룰이 적용된다는 점을 기억하세요.
면책사항
해당 정보와 게시물은 금융, 투자, 트레이딩 또는 기타 유형의 조언이나 권장 사항으로 간주되지 않으며, 트레이딩뷰에서 제공하거나 보증하는 것이 아닙니다. 자세한 내용은 이용 약관을 참조하세요.
오픈 소스 스크립트
트레이딩뷰의 진정한 정신에 따라, 이 스크립트의 작성자는 이를 오픈소스로 공개하여 트레이더들이 기능을 검토하고 검증할 수 있도록 했습니다. 작성자에게 찬사를 보냅니다! 이 코드는 무료로 사용할 수 있지만, 코드를 재게시하는 경우 하우스 룰이 적용된다는 점을 기억하세요.
면책사항
해당 정보와 게시물은 금융, 투자, 트레이딩 또는 기타 유형의 조언이나 권장 사항으로 간주되지 않으며, 트레이딩뷰에서 제공하거나 보증하는 것이 아닙니다. 자세한 내용은 이용 약관을 참조하세요.