OPEN-SOURCE SCRIPT
Omega Ratio
The Omega Ratio Indicator is a powerful tool designed to measure the risk-adjusted performance of an asset. Unlike traditional measures like the Sharpe or Sortino Ratios, the Omega Ratio considers both the frequency and magnitude of returns above and below a specified target return, providing a more comprehensive view of an asset's performance. This makes it an ideal choice for traders and investors seeking to evaluate the probability of achieving a desired return relative to the risk taken.
Features:
Calculation Period Input: Allows users to specify the period over which the Omega Ratio is calculated, making it flexible and adaptable to various trading strategies and time frames.
Target Return Input: Users can set a specific target return, enabling a customized risk-return analysis based on individual investment goals.
Daily Returns Calculation: The indicator calculates daily returns, which are used to determine the cumulative returns above and below the target return.
Omega Ratio Calculation: By dividing the cumulative returns above the target return by the cumulative returns below it, the indicator provides a clear measure of the likelihood of achieving the target return.
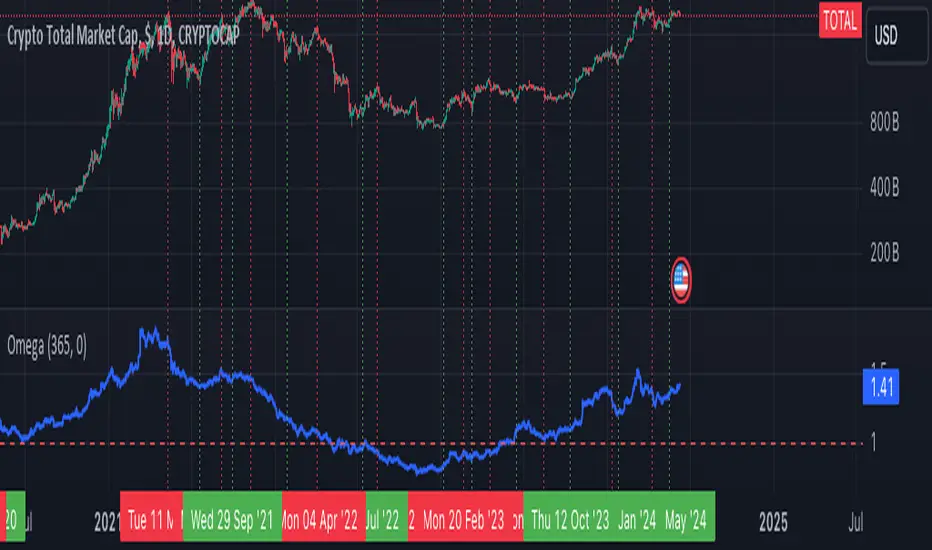
Visual Plot: The Omega Ratio is plotted on the chart, with a reference line at 1, helping users quickly assess whether the asset's returns are favorable relative to the target.
How to Use:
Add the Indicator to Your Chart: Copy the script into the Pine Script editor on TradingView and add it to your chart.
Specify the Calculation Period: Adjust the Calculation Period input to match your desired time frame for the Omega Ratio calculation.
Set the Target Return: Input your desired target return to customize the risk-return analysis.
Interpret the Omega Ratio: An Omega Ratio greater than 1 indicates that the asset's returns are more likely to exceed the target return than to fall short, whereas a ratio less than 1 suggests the opposite.
Features:
Calculation Period Input: Allows users to specify the period over which the Omega Ratio is calculated, making it flexible and adaptable to various trading strategies and time frames.
Target Return Input: Users can set a specific target return, enabling a customized risk-return analysis based on individual investment goals.
Daily Returns Calculation: The indicator calculates daily returns, which are used to determine the cumulative returns above and below the target return.
Omega Ratio Calculation: By dividing the cumulative returns above the target return by the cumulative returns below it, the indicator provides a clear measure of the likelihood of achieving the target return.
Visual Plot: The Omega Ratio is plotted on the chart, with a reference line at 1, helping users quickly assess whether the asset's returns are favorable relative to the target.
How to Use:
Add the Indicator to Your Chart: Copy the script into the Pine Script editor on TradingView and add it to your chart.
Specify the Calculation Period: Adjust the Calculation Period input to match your desired time frame for the Omega Ratio calculation.
Set the Target Return: Input your desired target return to customize the risk-return analysis.
Interpret the Omega Ratio: An Omega Ratio greater than 1 indicates that the asset's returns are more likely to exceed the target return than to fall short, whereas a ratio less than 1 suggests the opposite.
오픈 소스 스크립트
트레이딩뷰의 진정한 정신에 따라, 이 스크립트의 작성자는 이를 오픈소스로 공개하여 트레이더들이 기능을 검토하고 검증할 수 있도록 했습니다. 작성자에게 찬사를 보냅니다! 이 코드는 무료로 사용할 수 있지만, 코드를 재게시하는 경우 하우스 룰이 적용된다는 점을 기억하세요.
면책사항
해당 정보와 게시물은 금융, 투자, 트레이딩 또는 기타 유형의 조언이나 권장 사항으로 간주되지 않으며, 트레이딩뷰에서 제공하거나 보증하는 것이 아닙니다. 자세한 내용은 이용 약관을 참조하세요.
오픈 소스 스크립트
트레이딩뷰의 진정한 정신에 따라, 이 스크립트의 작성자는 이를 오픈소스로 공개하여 트레이더들이 기능을 검토하고 검증할 수 있도록 했습니다. 작성자에게 찬사를 보냅니다! 이 코드는 무료로 사용할 수 있지만, 코드를 재게시하는 경우 하우스 룰이 적용된다는 점을 기억하세요.
면책사항
해당 정보와 게시물은 금융, 투자, 트레이딩 또는 기타 유형의 조언이나 권장 사항으로 간주되지 않으며, 트레이딩뷰에서 제공하거나 보증하는 것이 아닙니다. 자세한 내용은 이용 약관을 참조하세요.