OPEN-SOURCE SCRIPT
업데이트됨 Foxy's Z-Score
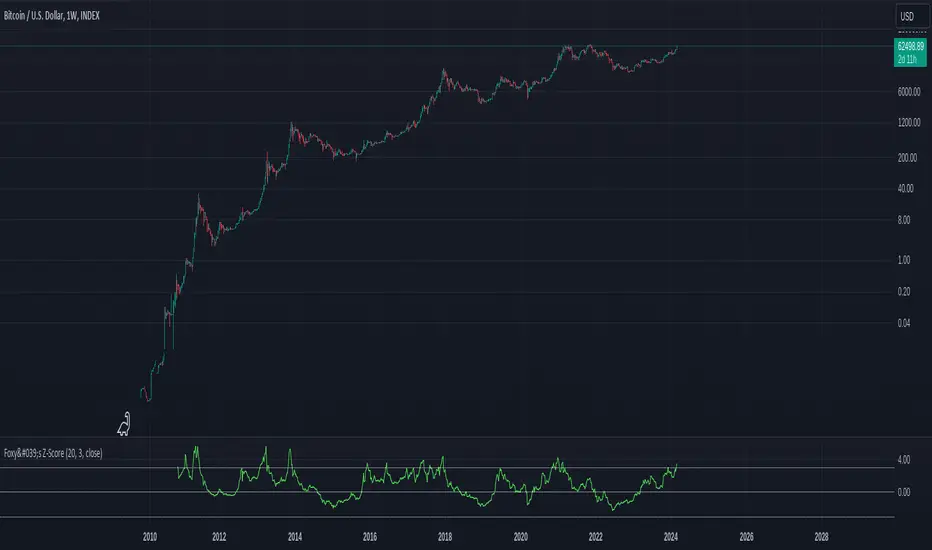
Introducing Foxy's Z-Score Indicator, a powerful tool for identifying potential trend reversals and market anomalies. This indicator calculates the Z-Score of the closing price, which represents the number of standard deviations from the mean, providing valuable insights into the market's behavior.
Key Features:
Auto Length Selection: The script automatically selects the optimal length based on the selected timeframe, ensuring accurate calculations and relevant signals.
Customizable Length and Standard Deviations: Users can manually input their preferred length and standard deviation values, offering flexibility to adapt to various trading strategies and market conditions.
Visual Representation: The indicator plots the Z-Score line along with three horizontal lines representing the standard deviation values, making it easy to identify overbought and oversold conditions.
Multiple Timeframes: The indicator works seamlessly across different timeframes, allowing traders to analyze short-term and long-term trends.
By incorporating Foxy's Z-Score Indicator into your trading toolkit, you can enhance your ability to spot potential market reversals and make more informed trading decisions.
릴리즈 노트
Add Option to Smooth Source릴리즈 노트
Add Multiple MA and Fix Default Parameters릴리즈 노트
Add DSMA오픈 소스 스크립트
트레이딩뷰의 진정한 정신에 따라, 이 스크립트의 작성자는 이를 오픈소스로 공개하여 트레이더들이 기능을 검토하고 검증할 수 있도록 했습니다. 작성자에게 찬사를 보냅니다! 이 코드는 무료로 사용할 수 있지만, 코드를 재게시하는 경우 하우스 룰이 적용된다는 점을 기억하세요.
면책사항
해당 정보와 게시물은 금융, 투자, 트레이딩 또는 기타 유형의 조언이나 권장 사항으로 간주되지 않으며, 트레이딩뷰에서 제공하거나 보증하는 것이 아닙니다. 자세한 내용은 이용 약관을 참조하세요.
오픈 소스 스크립트
트레이딩뷰의 진정한 정신에 따라, 이 스크립트의 작성자는 이를 오픈소스로 공개하여 트레이더들이 기능을 검토하고 검증할 수 있도록 했습니다. 작성자에게 찬사를 보냅니다! 이 코드는 무료로 사용할 수 있지만, 코드를 재게시하는 경우 하우스 룰이 적용된다는 점을 기억하세요.
면책사항
해당 정보와 게시물은 금융, 투자, 트레이딩 또는 기타 유형의 조언이나 권장 사항으로 간주되지 않으며, 트레이딩뷰에서 제공하거나 보증하는 것이 아닙니다. 자세한 내용은 이용 약관을 참조하세요.