OPEN-SOURCE SCRIPT
support and resistance on multi timeframe [parsimaj]
Description:
support and resistance and trendline on two timeframes by your choice
This indicator is capable of showing you the current and higher timeframe support and resistance by your strategy choice (two timeframes alongside each other). It also helps you to monitor the trend direction in short and long term by trend lines . You can change the depth of every levels and trend lines from the panel. Use this indicator in all markets because it follows the basic principles of levels but is unique in changing second timeframe by your choice.
_its smart , if the levels are too close together ,it will choose the deeper ones for you.
How it works:
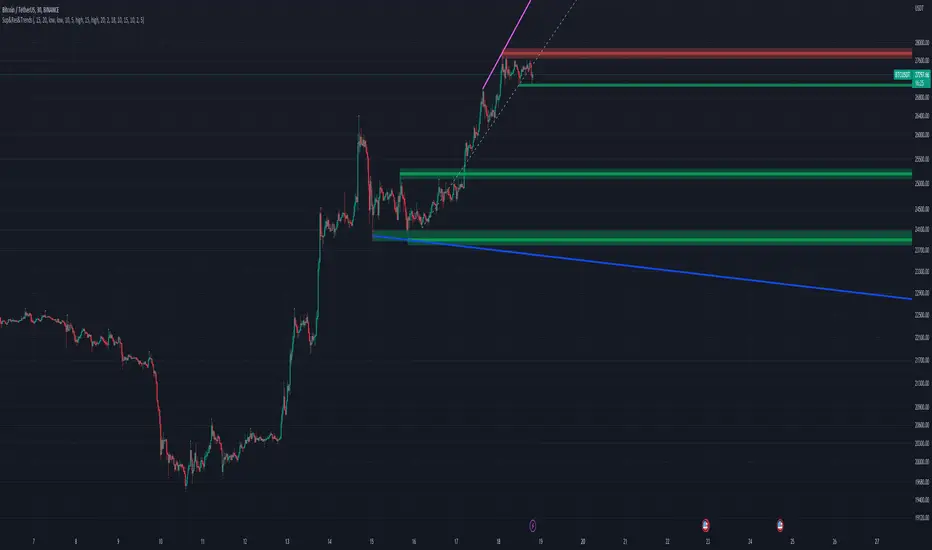
By default, there is no higher timeframe and you can select your desire higher timeframe from the panel. Higher timelines will be displayed thicker and your current levels would be thin lines. (Levels that are higher than the current price will be red and those that are lower will be green). The number of levels to display is also by your choice, the default is 4 levels for each timeframe.
We have two types of trend lines , long terms as trend 1 (blue below and purple above trend line )- short term as trend 2(dashed ones).
Bouncing on levels and breaking trend line are the best triggers for entry and exit points.
Setting:
First, choose your higher timeframe then the depth of levels for each time (current and higher), The deeper it is, the more precise the lines. After that you can set the depth of trend lines by your choice. Trend 1 is the longer term So put it deeper and then set the short trend line (dashed ones) if you want to change it.
We have put the settings in the best mode, but you can also change it according to your strategy and inform us about the results.
This indicator has been obtained with hours of effort and codding , hope you enjoy
support and resistance and trendline on two timeframes by your choice
This indicator is capable of showing you the current and higher timeframe support and resistance by your strategy choice (two timeframes alongside each other). It also helps you to monitor the trend direction in short and long term by trend lines . You can change the depth of every levels and trend lines from the panel. Use this indicator in all markets because it follows the basic principles of levels but is unique in changing second timeframe by your choice.
_its smart , if the levels are too close together ,it will choose the deeper ones for you.
How it works:
By default, there is no higher timeframe and you can select your desire higher timeframe from the panel. Higher timelines will be displayed thicker and your current levels would be thin lines. (Levels that are higher than the current price will be red and those that are lower will be green). The number of levels to display is also by your choice, the default is 4 levels for each timeframe.
We have two types of trend lines , long terms as trend 1 (blue below and purple above trend line )- short term as trend 2(dashed ones).
Bouncing on levels and breaking trend line are the best triggers for entry and exit points.
Setting:
First, choose your higher timeframe then the depth of levels for each time (current and higher), The deeper it is, the more precise the lines. After that you can set the depth of trend lines by your choice. Trend 1 is the longer term So put it deeper and then set the short trend line (dashed ones) if you want to change it.
We have put the settings in the best mode, but you can also change it according to your strategy and inform us about the results.
This indicator has been obtained with hours of effort and codding , hope you enjoy
오픈 소스 스크립트
트레이딩뷰의 진정한 정신에 따라, 이 스크립트의 작성자는 이를 오픈소스로 공개하여 트레이더들이 기능을 검토하고 검증할 수 있도록 했습니다. 작성자에게 찬사를 보냅니다! 이 코드는 무료로 사용할 수 있지만, 코드를 재게시하는 경우 하우스 룰이 적용된다는 점을 기억하세요.
면책사항
해당 정보와 게시물은 금융, 투자, 트레이딩 또는 기타 유형의 조언이나 권장 사항으로 간주되지 않으며, 트레이딩뷰에서 제공하거나 보증하는 것이 아닙니다. 자세한 내용은 이용 약관을 참조하세요.
오픈 소스 스크립트
트레이딩뷰의 진정한 정신에 따라, 이 스크립트의 작성자는 이를 오픈소스로 공개하여 트레이더들이 기능을 검토하고 검증할 수 있도록 했습니다. 작성자에게 찬사를 보냅니다! 이 코드는 무료로 사용할 수 있지만, 코드를 재게시하는 경우 하우스 룰이 적용된다는 점을 기억하세요.
면책사항
해당 정보와 게시물은 금융, 투자, 트레이딩 또는 기타 유형의 조언이나 권장 사항으로 간주되지 않으며, 트레이딩뷰에서 제공하거나 보증하는 것이 아닙니다. 자세한 내용은 이용 약관을 참조하세요.