PROTECTED SOURCE SCRIPT
업데이트됨 #TheStrat Based Sector Rotation on an intraday basis
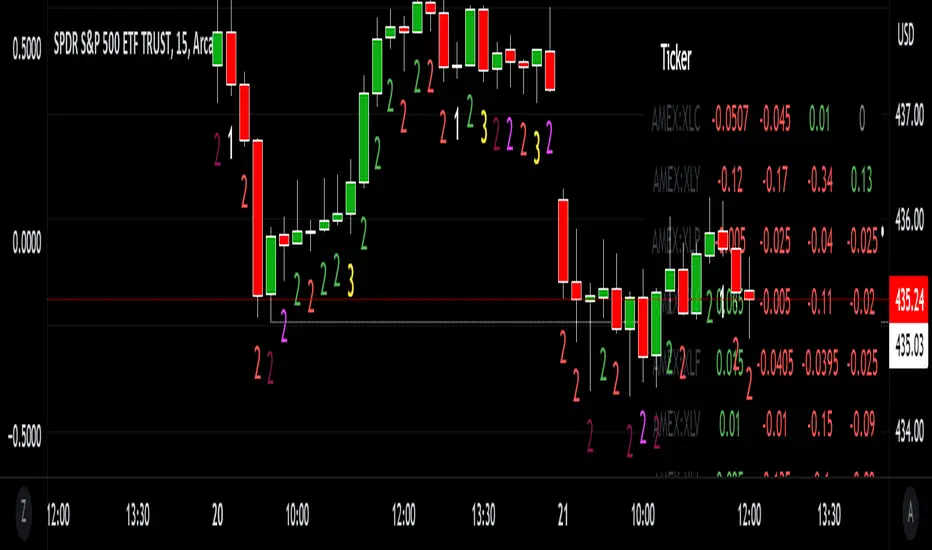
This script will show the close to close change on any timeframe it is set to across all the SPDR sector selectors [minus 1 because tradingview limits to 40!]
Green colors dictate a positive close to close change on the specified timeframe.
Red colors dictate a negative close to close change on the specified timeframe.
When all of the values flip red or a wave of red or green begins to come over it signals a move that is supported by all of the underlying components of the SPY. This is important to know because when you get a simultaneous break [#TheStrat term] you will then have aggressive participants. This is because the whole market is moving the same, meaning 'the big boys' are buying or selling everything all at once! When that happens the moves are much greater.
Tickers can be changed in settings, OF NOTE. When a ticker is changed the table cell name will not change. I have not found a way to use ticker names in the table cells so just will be a quirk for now.
릴리즈 노트
This update changes data to be portrayed from oldest to newest in a left to right fashion on the dashboard.보호된 스크립트입니다
이 스크립트는 비공개 소스로 게시됩니다. 하지만 이를 자유롭게 제한 없이 사용할 수 있습니다 – 자세한 내용은 여기에서 확인하세요.
면책사항
해당 정보와 게시물은 금융, 투자, 트레이딩 또는 기타 유형의 조언이나 권장 사항으로 간주되지 않으며, 트레이딩뷰에서 제공하거나 보증하는 것이 아닙니다. 자세한 내용은 이용 약관을 참조하세요.
보호된 스크립트입니다
이 스크립트는 비공개 소스로 게시됩니다. 하지만 이를 자유롭게 제한 없이 사용할 수 있습니다 – 자세한 내용은 여기에서 확인하세요.
면책사항
해당 정보와 게시물은 금융, 투자, 트레이딩 또는 기타 유형의 조언이나 권장 사항으로 간주되지 않으며, 트레이딩뷰에서 제공하거나 보증하는 것이 아닙니다. 자세한 내용은 이용 약관을 참조하세요.