OPEN-SOURCE SCRIPT
IKAKOver2(LITE雲なし)
change point
I tried to make the operation lighter by removing the display of the Ichimoku balance table.
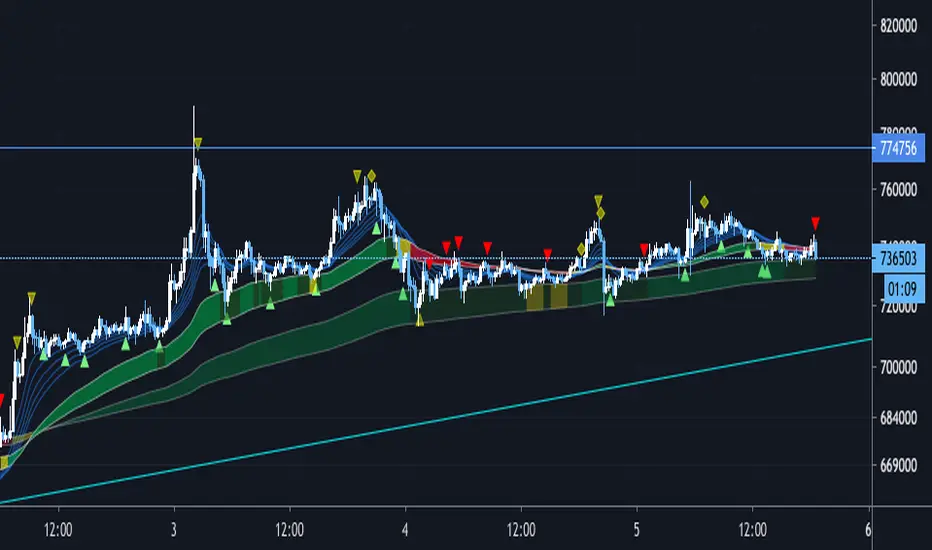
We have set a period such as EMA to use 5 minute bars and the first band is period 60 and 100 EMA . The color of the belt changes according to the position of the period 5EMA-25EMA-50EMA. The second sash is based on a 60- and 100-EMA period of 15 minutes. The change in the color of the obi is also a 15-minute specification.
Since the above period can be changed, I think that there are customs such as 1 hour and 4 hours.
Buying and selling signs are shown in green for buying and red for selling. (More frequent)
For the time being, it is also possible to display the Ichimoku balance table.
As for my usage method, when both the 15-minute and 5-minute bars have an uptrend (downtrend ), when each trading sign is confirmed, spread the limit just below the price. . (Because there is a commission in the market)
If the color of the obi becomes yellow, the trend may be over, so wait for the signature to reach the bundle of 15 minutes instead of 5 minutes, and after the signature is confirmed, it is the same as 5 minutes.
The loss cut line is often the latest low. Or when the obi is broken. .
I am still studying about profitability. Sometimes we use indicators, sometimes we reach the target horizon. I think each way is good.
It is a discretionary aid, and the head and tail are cut off, and the image is about 10 to 100 $.
오픈 소스 스크립트
트레이딩뷰의 진정한 정신에 따라, 이 스크립트의 작성자는 이를 오픈소스로 공개하여 트레이더들이 기능을 검토하고 검증할 수 있도록 했습니다. 작성자에게 찬사를 보냅니다! 이 코드는 무료로 사용할 수 있지만, 코드를 재게시하는 경우 하우스 룰이 적용된다는 점을 기억하세요.
면책사항
해당 정보와 게시물은 금융, 투자, 트레이딩 또는 기타 유형의 조언이나 권장 사항으로 간주되지 않으며, 트레이딩뷰에서 제공하거나 보증하는 것이 아닙니다. 자세한 내용은 이용 약관을 참조하세요.
오픈 소스 스크립트
트레이딩뷰의 진정한 정신에 따라, 이 스크립트의 작성자는 이를 오픈소스로 공개하여 트레이더들이 기능을 검토하고 검증할 수 있도록 했습니다. 작성자에게 찬사를 보냅니다! 이 코드는 무료로 사용할 수 있지만, 코드를 재게시하는 경우 하우스 룰이 적용된다는 점을 기억하세요.
면책사항
해당 정보와 게시물은 금융, 투자, 트레이딩 또는 기타 유형의 조언이나 권장 사항으로 간주되지 않으며, 트레이딩뷰에서 제공하거나 보증하는 것이 아닙니다. 자세한 내용은 이용 약관을 참조하세요.