OPEN-SOURCE SCRIPT
Breakout Swing High Low
This open-source indicator identifies swing high and swing low breakouts, providing clear visual signals for potential trend entries. It is designed for traders who use price action to spot breakout opportunities in trending markets.
How It Works
Swing Detection: The indicator uses a user-defined lookback period (default: 4 candles) to identify swing highs (peaks) and swing lows (troughs). A swing high is confirmed when a candle's high is higher than the surrounding candles, and a swing low is confirmed when a candle's low is lower.
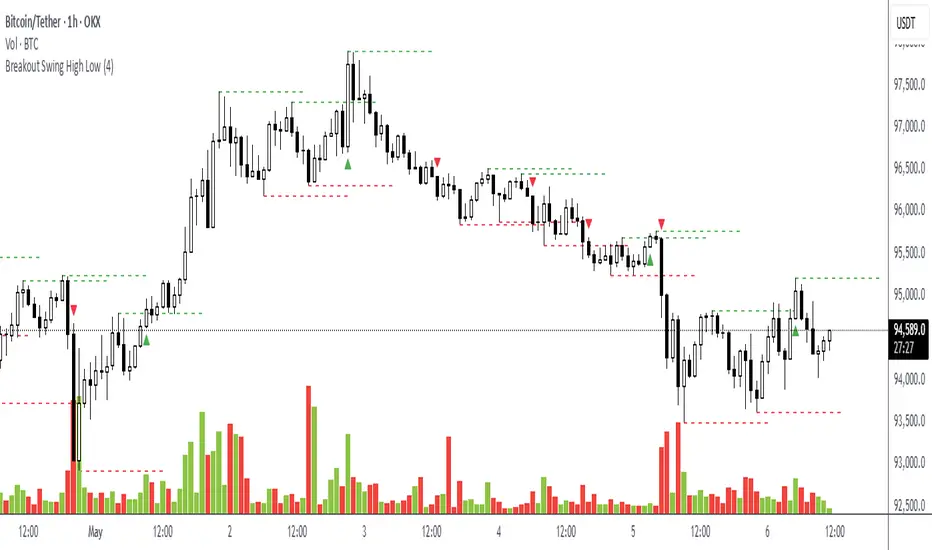
Breakout Signals: A green triangle below the candle signals a breakout above the most recent swing high, indicating a potential buy opportunity. A red triangle above the candle signals a breakout below the most recent swing low, indicating a potential sell opportunity. Each swing level triggers only one breakout signal to avoid clutter.
Visualization: Swing high levels are drawn as green dashed lines, and swing low levels as red dashed lines, extending 15 candles for clarity. Breakout signals are marked with small triangles.
How to Use
Apply the Indicator: Add the indicator to your TradingView chart.
Adjust Lookback: Set the "Lookback Candles" input (default: 4) to control the sensitivity of swing detection. Smaller values detect shorter-term swings, while larger values identify more significant levels.
Interpret Signals:
Green triangle (below candle): Consider a buy opportunity when price breaks above a swing high.
Red triangle (above candle): Consider a sell opportunity when price breaks below a swing low.
Combine with Other Tools: Use in conjunction with trend indicators (e.g., 50-period EMA) or support/resistance levels to filter signals in trending markets.
Timeframes: Works best on higher timeframes (e.g., 1H, 4H) in trending markets to avoid false breakouts in sideways conditions.
How It Works
Swing Detection: The indicator uses a user-defined lookback period (default: 4 candles) to identify swing highs (peaks) and swing lows (troughs). A swing high is confirmed when a candle's high is higher than the surrounding candles, and a swing low is confirmed when a candle's low is lower.
Breakout Signals: A green triangle below the candle signals a breakout above the most recent swing high, indicating a potential buy opportunity. A red triangle above the candle signals a breakout below the most recent swing low, indicating a potential sell opportunity. Each swing level triggers only one breakout signal to avoid clutter.
Visualization: Swing high levels are drawn as green dashed lines, and swing low levels as red dashed lines, extending 15 candles for clarity. Breakout signals are marked with small triangles.
How to Use
Apply the Indicator: Add the indicator to your TradingView chart.
Adjust Lookback: Set the "Lookback Candles" input (default: 4) to control the sensitivity of swing detection. Smaller values detect shorter-term swings, while larger values identify more significant levels.
Interpret Signals:
Green triangle (below candle): Consider a buy opportunity when price breaks above a swing high.
Red triangle (above candle): Consider a sell opportunity when price breaks below a swing low.
Combine with Other Tools: Use in conjunction with trend indicators (e.g., 50-period EMA) or support/resistance levels to filter signals in trending markets.
Timeframes: Works best on higher timeframes (e.g., 1H, 4H) in trending markets to avoid false breakouts in sideways conditions.
오픈 소스 스크립트
트레이딩뷰의 진정한 정신에 따라, 이 스크립트의 작성자는 이를 오픈소스로 공개하여 트레이더들이 기능을 검토하고 검증할 수 있도록 했습니다. 작성자에게 찬사를 보냅니다! 이 코드는 무료로 사용할 수 있지만, 코드를 재게시하는 경우 하우스 룰이 적용된다는 점을 기억하세요.
면책사항
해당 정보와 게시물은 금융, 투자, 트레이딩 또는 기타 유형의 조언이나 권장 사항으로 간주되지 않으며, 트레이딩뷰에서 제공하거나 보증하는 것이 아닙니다. 자세한 내용은 이용 약관을 참조하세요.
오픈 소스 스크립트
트레이딩뷰의 진정한 정신에 따라, 이 스크립트의 작성자는 이를 오픈소스로 공개하여 트레이더들이 기능을 검토하고 검증할 수 있도록 했습니다. 작성자에게 찬사를 보냅니다! 이 코드는 무료로 사용할 수 있지만, 코드를 재게시하는 경우 하우스 룰이 적용된다는 점을 기억하세요.
면책사항
해당 정보와 게시물은 금융, 투자, 트레이딩 또는 기타 유형의 조언이나 권장 사항으로 간주되지 않으며, 트레이딩뷰에서 제공하거나 보증하는 것이 아닙니다. 자세한 내용은 이용 약관을 참조하세요.