OPEN-SOURCE SCRIPT
업데이트됨 Equal Highs and Lows
Description:
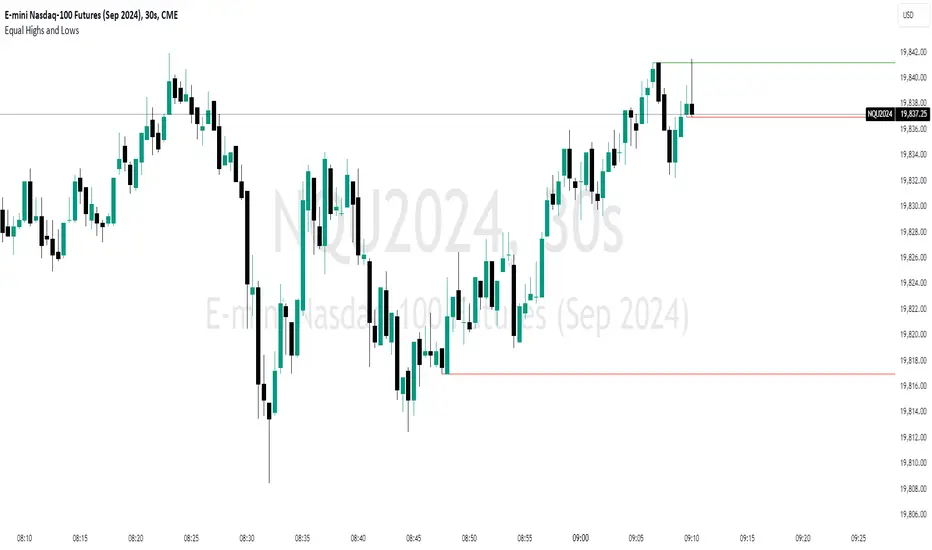
The ‘Equal Highs and Lows’ indicator is a technical analysis tool that marks identical price levels on a trading chart using the current time-frame, assisting traders in identifying potential support and resistance zones or liquidity draws. It creates a horizontal line connecting points where the price has created equal highs and lows within a specified lookback period. Unique to this tool, it maintains a clean chart by removing the line once the price surpasses the equal highs or falls below the equal lows, ensuring only the currently relevant equal highs and lows are highlighted.
Features:
Customization Options: Users can adjust the appearance of the lines (color, width, and style) to match their chart setup or preferences. Users can also choose to extend the lines marking the equal highs/lows to the right of the chart making the equal high/low levels more easier to visualize.
User-Defined Lookback Length: The number of bars to look back for finding equal highs and lows can be set by the user, allowing for flexibility in different market conditions.
How It Works:
The indicator meticulously scans the chart over a user-specified lookback duration, identifying bars with matching high or low values that have not been mitigated on the current chat timeframe, thereby constructing an index of equal values. It subsequently connects these equal values on the chart with a line. While this intuitive indicator does not forecast future market trends, it emphasizes significant price levels derived from historical data.
Usage:
Identifying Support and Resistance: The lines drawn by the indicator can be used to identify potential support and resistance zones and/or draws of liquidity, which are crucial for making informed trading decisions.
Strategy Development: Traders can incorporate the visual cues provided by the indicator into their trading strategies, using them as one of the factors for entry or exit decisions.
Originality:
This indicator presents a distinctive method for pinpointing and illustrating equal highs and lows, granting traders a crucial insight into key price levels. It stands apart from conventional indicators by offering extensive personalization and employing a novel approach to augment chart analysis. Uniquely, it retains only unmitigated equal high/low levels on the chart, automatically discarding mitigated price levels once the price has reached that level.
Conclusion:
The "Equal Highs and Lows" indicator is a practical tool for traders looking to enhance their chart analysis with visual cues of significant price levels. Its customization options and innovative approach make it a valuable addition to the trading toolkit, suitable for various trading styles and strategies.
릴리즈 노트
This Pine script indicator is designed to create a visual representation of the equal highs & lows formed and automatically removed mitigated ones.Relevance:
Equal highs and lows can serve as valuable tools in identifying potential shifts in trend direction. They come into play when the price hits a support or resistance level and can’t advance further, signaling a possible reversal or pivot point. When the price sufficiently retreats from these levels, equal highs and lows can also indicate liquidity draws where buy/sell stops might be positioned, in accordance with SMC/ICT concepts.
How It Works:
The indicator scrutinizes each price bar within the chart’s present timeframe, limited to the user-defined max bars lookback for optimal performance. It captures and visually depicts each occurrence of equal prices with a horizontal line on the chart, connecting two points of equal price. A unique feature of this tool is its ability to remove the line once the price mitigates the equal high/low by falling below the equal lows or rising above equal highs. This ensures the chart remains uncluttered and highlights only the currently relevant levels, setting it apart from other indicators designed to identify equal highs/lows.
Configurability:
The indicator offers five style settings for complete customization of the lines that represent equal highs/lows. These settings include line style, color, and width, along with an option to extend the lines to the right of the chart for enhanced visibility of equal high/low levels. To optimize performance, the indicator allows users to configure the lookback length, determining how far back the price history should be examined. In most instances, the default setting of 500 bars proves more than adequate.
릴리즈 노트
Added maximum value for loopback length to prevent overflow issues when value is set to >999릴리즈 노트
Adjusted loopback configuration setting- Allow maximum value of up-to 5,000
- Set a minimum at 100
- Configure step increment as 50, to simplify adjusting of values
릴리즈 노트
Fixed a bug where 1st set of EQL/EQH was not being shown릴리즈 노트
- Removed loopback length restriction, the indicator will now go as far back as your chart allows to identify valid equal highs & lows.
- Added "Minimum Distance (candles/bars)" setting, off by default, to keep existing behavior the same. This setting allows you to set minimum distance between the candles that form equal highs & lows. Particularly useful for lower timeframes where equal highs/lows formed in close proximity to one another may not represent any meaningful liquidity.
- Added "Show Nearest EQL/EQH Price" setting, off by default, to keep existing behavior the same. If enabled it'll highlight the price of the closest valid Equal Low/High on the price bar.
릴리즈 노트
Update script to remove broken EQH/EQL in realtime, however new EQH/EQL are only marked once candle is closed.릴리즈 노트
- Added Realtime option, to show Equal Highs/Lows as soon as they are formed
- Improve layout of indicator settings
오픈 소스 스크립트
트레이딩뷰의 진정한 정신에 따라, 이 스크립트의 작성자는 이를 오픈소스로 공개하여 트레이더들이 기능을 검토하고 검증할 수 있도록 했습니다. 작성자에게 찬사를 보냅니다! 이 코드는 무료로 사용할 수 있지만, 코드를 재게시하는 경우 하우스 룰이 적용된다는 점을 기억하세요.
면책사항
해당 정보와 게시물은 금융, 투자, 트레이딩 또는 기타 유형의 조언이나 권장 사항으로 간주되지 않으며, 트레이딩뷰에서 제공하거나 보증하는 것이 아닙니다. 자세한 내용은 이용 약관을 참조하세요.
오픈 소스 스크립트
트레이딩뷰의 진정한 정신에 따라, 이 스크립트의 작성자는 이를 오픈소스로 공개하여 트레이더들이 기능을 검토하고 검증할 수 있도록 했습니다. 작성자에게 찬사를 보냅니다! 이 코드는 무료로 사용할 수 있지만, 코드를 재게시하는 경우 하우스 룰이 적용된다는 점을 기억하세요.
면책사항
해당 정보와 게시물은 금융, 투자, 트레이딩 또는 기타 유형의 조언이나 권장 사항으로 간주되지 않으며, 트레이딩뷰에서 제공하거나 보증하는 것이 아닙니다. 자세한 내용은 이용 약관을 참조하세요.