INVITE-ONLY SCRIPT
업데이트됨 SFC Macroeconomics
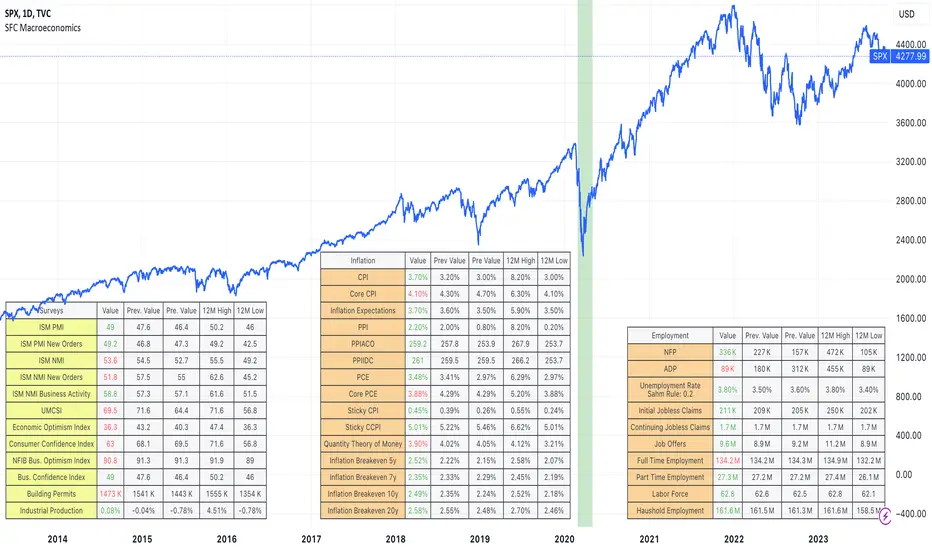
The Macroeconomics indicator can give us an instant view of the most important economic indicators. The indicator displays different tables in different sectors:
- Money : It give us a basic information about the money indicators in USA;
- Surveys: They are usually used as leading indicators.
- Inflation: It is showing overall inflation in the country
- Employment: Provides deep information about the current labor market
- Government: Usually legging indicators, but providing very good information about the USA
- Others: Few important indicators, for example GDP.
How we can use the indicator:
1) The indicator can be used to help traders, getting an instant overview of the economic indicators, helping them to create the Macroeconomic analysis.
2) The indicator can be use as a preparation before the high-impact news.
Note:
Yellow colour - leading indicators
Orange colour - legging indicators
Tables are showing the current data, also 12 months high and low. This is very important information, because it shows the extremes and normally if the current data is 12 months high or low it will be observed by the big players.
Before use this indicator, traders need basic macroeconomic understanding. A good knowledge is required in order to take advantage of the indicators and create the economic analysis or bias.
릴리즈 노트
-added ADP릴리즈 노트
- added historical recession- added Sahm Rule
- changed the overlay
릴리즈 노트
- new symbols added to give us a more detailed picture- transferred some of the data to another indicator
- Show more previous values to understand how data changes.
- added tooltips
초대 전용 스크립트
이 스크립트는 작성자가 승인한 사용자만 접근할 수 있습니다. 사용하려면 요청 후 승인을 받아야 하며, 일반적으로 결제 후에 허가가 부여됩니다. 자세한 내용은 아래 작성자의 안내를 따르거나 SerpentForexClub에게 직접 문의하세요.
트레이딩뷰는 스크립트의 작동 방식을 충분히 이해하고 작성자를 완전히 신뢰하지 않는 이상, 해당 스크립트에 비용을 지불하거나 사용하는 것을 권장하지 않습니다. 커뮤니티 스크립트에서 무료 오픈소스 대안을 찾아보실 수도 있습니다.
작성자 지시 사항
Contact me through the PM system.
면책사항
해당 정보와 게시물은 금융, 투자, 트레이딩 또는 기타 유형의 조언이나 권장 사항으로 간주되지 않으며, 트레이딩뷰에서 제공하거나 보증하는 것이 아닙니다. 자세한 내용은 이용 약관을 참조하세요.