OPEN-SOURCE SCRIPT
Sharpe Ratio Indicator (180)
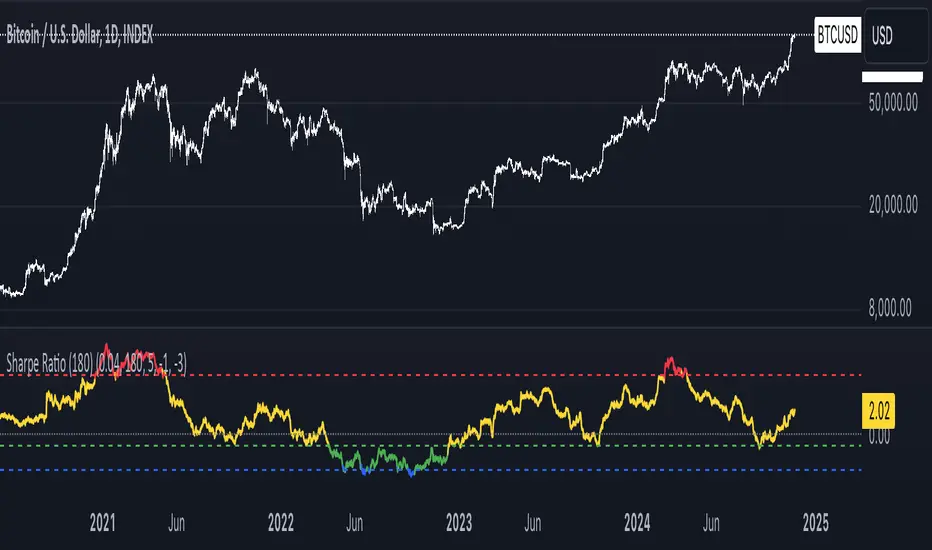
Meant to be used on the 1D chart and on BTC.
The Sharpe Ratio Indicator (180 days) is a tool for evaluating risk-adjusted returns, designed for investors who want to assess whether BTC is overvalued, undervalued, or in a neutral state. It plots the Sharpe Ratio over the past 180 days, color-coded to indicate valuation states:
- Red: Overvalued (Sharpe Ratio > 5).
- Green: Undervalued (Sharpe Ratio < -1).
-Blue: Critically Undervalued (Sharpe Ratio <-3).
- Yellow: Neutral (between -1 and 5).
Note that you can change those values yourself in the settings of the indicator.
Strengths:
- Real-time feedback on risk-adjusted returns helps in making timely investment decisions.
- Color-coded signals (red, green, blue and yellow) provide an intuitive, visual indication of the asset's valuation.
- Flexible: Easily adjustable to different subjective valuation levels and risk-free rates.
All hail to Professor Adam and The Real World Community!
오픈 소스 스크립트
트레이딩뷰의 진정한 정신에 따라, 이 스크립트의 작성자는 이를 오픈소스로 공개하여 트레이더들이 기능을 검토하고 검증할 수 있도록 했습니다. 작성자에게 찬사를 보냅니다! 이 코드는 무료로 사용할 수 있지만, 코드를 재게시하는 경우 하우스 룰이 적용된다는 점을 기억하세요.
면책사항
해당 정보와 게시물은 금융, 투자, 트레이딩 또는 기타 유형의 조언이나 권장 사항으로 간주되지 않으며, 트레이딩뷰에서 제공하거나 보증하는 것이 아닙니다. 자세한 내용은 이용 약관을 참조하세요.
오픈 소스 스크립트
트레이딩뷰의 진정한 정신에 따라, 이 스크립트의 작성자는 이를 오픈소스로 공개하여 트레이더들이 기능을 검토하고 검증할 수 있도록 했습니다. 작성자에게 찬사를 보냅니다! 이 코드는 무료로 사용할 수 있지만, 코드를 재게시하는 경우 하우스 룰이 적용된다는 점을 기억하세요.
면책사항
해당 정보와 게시물은 금융, 투자, 트레이딩 또는 기타 유형의 조언이나 권장 사항으로 간주되지 않으며, 트레이딩뷰에서 제공하거나 보증하는 것이 아닙니다. 자세한 내용은 이용 약관을 참조하세요.