OPEN-SOURCE SCRIPT
[KVA]Volume Impulse
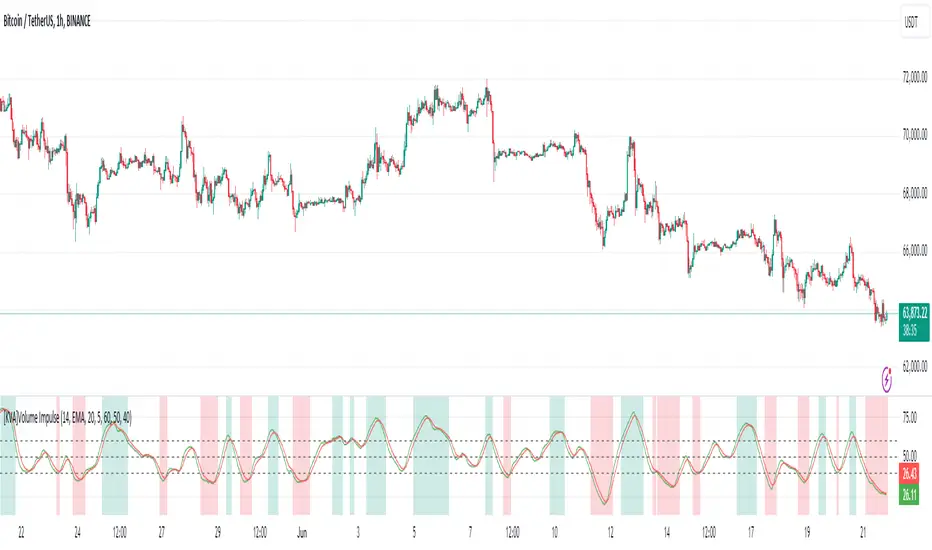
The [KVA] Volume Impulse indicator is designed to provide insights into market momentum by analyzing volume dynamics. It helps traders identify periods of strong buying and selling pressure, which can be crucial for making informed trading decisions.
What does the indicator do?
The [KVA] Volume Impulse indicator calculates positive and negative volume percentages based on the price range within each bar. It allows traders to visualize the distribution of volume and detect potential shifts in market sentiment.
How does it work?
The indicator uses a customizable lookback period to analyze volume data, smoothing the results with user-defined moving averages. By comparing the positive and negative volume percentages, the indicator highlights overbought and oversold conditions, aiding in trend detection and potential reversal points.
How to use it?
Identify Momentum: Use the positive and negative volume percentages to gauge market momentum within the specified lookback period.
Detect Overbought/Oversold Conditions: Look for the indicator crossing above the overbought level or below the oversold level to identify potential reversal points.
Smooth Trends: Adjust the moving average type and lengths to smooth out the volume data and identify trends more clearly.
Key Features
Inputs:
What does the indicator do?
The [KVA] Volume Impulse indicator calculates positive and negative volume percentages based on the price range within each bar. It allows traders to visualize the distribution of volume and detect potential shifts in market sentiment.
How does it work?
The indicator uses a customizable lookback period to analyze volume data, smoothing the results with user-defined moving averages. By comparing the positive and negative volume percentages, the indicator highlights overbought and oversold conditions, aiding in trend detection and potential reversal points.
How to use it?
Identify Momentum: Use the positive and negative volume percentages to gauge market momentum within the specified lookback period.
Detect Overbought/Oversold Conditions: Look for the indicator crossing above the overbought level or below the oversold level to identify potential reversal points.
Smooth Trends: Adjust the moving average type and lengths to smooth out the volume data and identify trends more clearly.
Key Features
- [] Volume Analysis: Calculates the positive and negative volume based on the price range within each bar.
[] Lookback Period: Allows you to define a lookback period over which the indicator calculations are performed, providing flexibility in analyzing different timeframes.
[] Customizable Moving Averages: Choose from various types of moving averages (EMA, SMA, WMA, Hull) to smooth the volume data.
[] Overbought/Oversold Levels: Visual markers for overbought, middle, and oversold conditions to help identify potential reversal points.
[] Color-Coded Areas: Highlights overbought and oversold regions with customizable colors for easy visual interpretation.
[] Plotting Options: Displays the positive volume and its smoothed version using the selected moving average type and length.
Inputs:
- [] Lookback Period: Define the period over which the volume analysis is performed.
[] Moving Average Type: Select the type of moving average (EMA, SMA, WMA, Hull) to be applied.
[] Moving Average Length: Set the length for the primary moving average.
[] Smooth Length: Define the length for the smoothed moving average.
[] Overbought Level: Set the threshold for overbought conditions.
[] Middle Level: Set the threshold for middle conditions.
[] Oversold Level: Set the threshold for oversold conditions.
[] Color Settings: Customize the colors for overbought and oversold areas and their respective fill colors.
오픈 소스 스크립트
트레이딩뷰의 진정한 정신에 따라, 이 스크립트의 작성자는 이를 오픈소스로 공개하여 트레이더들이 기능을 검토하고 검증할 수 있도록 했습니다. 작성자에게 찬사를 보냅니다! 이 코드는 무료로 사용할 수 있지만, 코드를 재게시하는 경우 하우스 룰이 적용된다는 점을 기억하세요.
면책사항
해당 정보와 게시물은 금융, 투자, 트레이딩 또는 기타 유형의 조언이나 권장 사항으로 간주되지 않으며, 트레이딩뷰에서 제공하거나 보증하는 것이 아닙니다. 자세한 내용은 이용 약관을 참조하세요.
오픈 소스 스크립트
트레이딩뷰의 진정한 정신에 따라, 이 스크립트의 작성자는 이를 오픈소스로 공개하여 트레이더들이 기능을 검토하고 검증할 수 있도록 했습니다. 작성자에게 찬사를 보냅니다! 이 코드는 무료로 사용할 수 있지만, 코드를 재게시하는 경우 하우스 룰이 적용된다는 점을 기억하세요.
면책사항
해당 정보와 게시물은 금융, 투자, 트레이딩 또는 기타 유형의 조언이나 권장 사항으로 간주되지 않으며, 트레이딩뷰에서 제공하거나 보증하는 것이 아닙니다. 자세한 내용은 이용 약관을 참조하세요.