PROTECTED SOURCE SCRIPT
PpSignal Renko
A renko chart is a type of financial chart of Japanese origin used in technical analysis that measures and plots price changes. A renko chart consists of bricks, which proponents say more clearly show market trends and increase the signal-to-noise ratio compared to typical candlestick charts
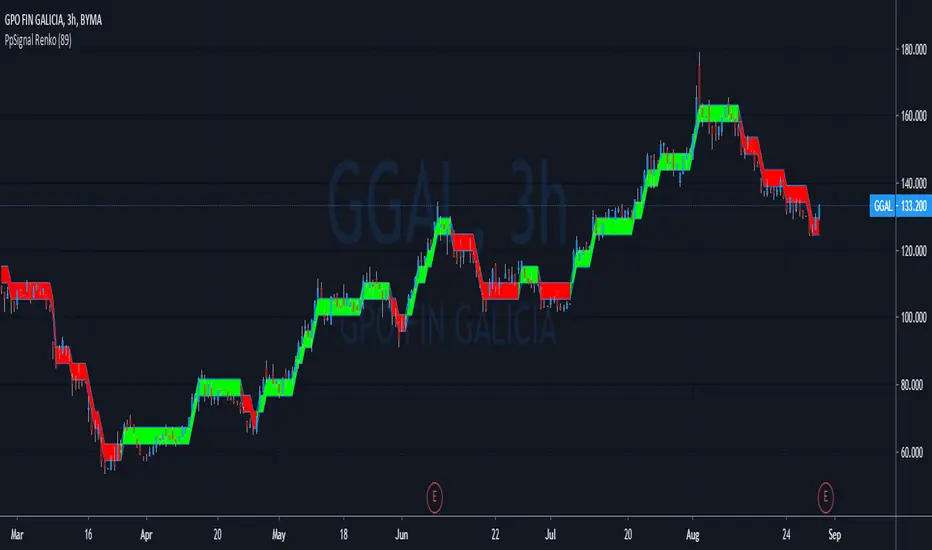
PpSignal Renko emulator you can see the Renko chart and the candle in the same time.
Work with atr Average true range.
Buy when the Renko is lime end sell when the Renko is red.
Be careful the Renko chart changes color when the close Renko price is higher than the open Renko so it can repaint up to the close price of the current candle
보호된 스크립트입니다
이 스크립트는 비공개 소스로 게시됩니다. 하지만 이를 자유롭게 제한 없이 사용할 수 있습니다 – 자세한 내용은 여기에서 확인하세요.
면책사항
해당 정보와 게시물은 금융, 투자, 트레이딩 또는 기타 유형의 조언이나 권장 사항으로 간주되지 않으며, 트레이딩뷰에서 제공하거나 보증하는 것이 아닙니다. 자세한 내용은 이용 약관을 참조하세요.
보호된 스크립트입니다
이 스크립트는 비공개 소스로 게시됩니다. 하지만 이를 자유롭게 제한 없이 사용할 수 있습니다 – 자세한 내용은 여기에서 확인하세요.
면책사항
해당 정보와 게시물은 금융, 투자, 트레이딩 또는 기타 유형의 조언이나 권장 사항으로 간주되지 않으며, 트레이딩뷰에서 제공하거나 보증하는 것이 아닙니다. 자세한 내용은 이용 약관을 참조하세요.