OPEN-SOURCE SCRIPT
3M_RANGE/ErkOzi/
Hello Dear Investors,
Today, I'd like to introduce you to an indicator called "3M Range" and explain how this indicator is calculated, as well as the kind of strategy it can offer.
What is the 3M Range Indicator?
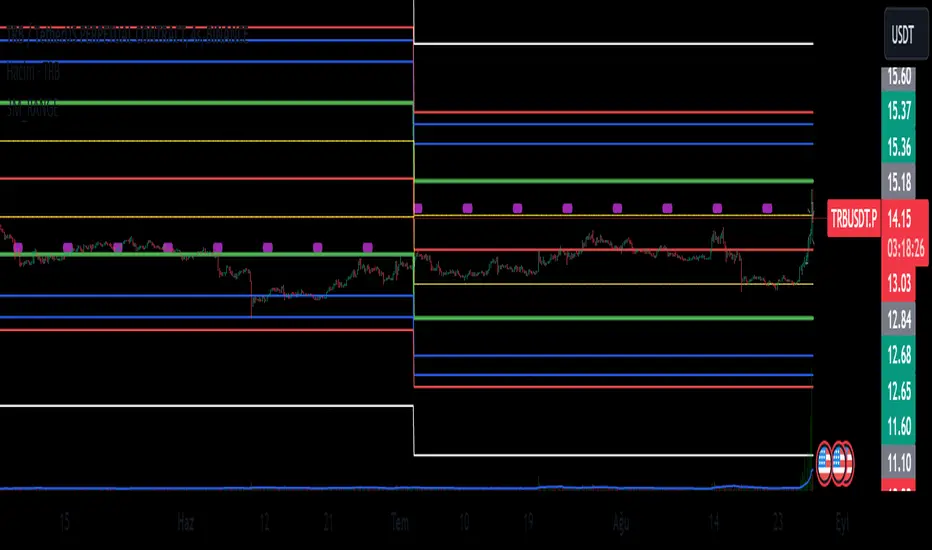
"3M Range" is an analytical tool designed to identify and visualize market movements within three-month periods. This indicator employs specific levels and Fibonacci levels to assist investors in understanding market trends.
How is it Calculated?
The indicator utilizes the opening, highest, and lowest prices of three-month periods starting on Mondays. By using these prices, the indicator tracks weekly opening prices and marks the opening prices every Monday.
How Does the Indicator's Strategy Work?
Using this indicator, you can refine your long-term investment strategies:
Identify Three-Month Periods: The indicator follows the opening, highest, and lowest prices in three-month periods. This allows for a clearer understanding of long-term trends.
Utilize Fibonacci Levels: The indicator calculates Fibonacci levels to show support and resistance levels. These levels can help predict potential reversals or ongoing movements.
Observe Monday Opening Prices: The indicator distinctly marks Monday opening prices. This helps you capture potential movements at the beginning of the week.
Evaluate Trends and Opportunities: By using the indicator, you can observe long-term trends and potential market opportunities more clearly.
In Conclusion,
The "3M Range" indicator provides long-term investors with a better analytical tool by showcasing market movements within three-month periods. The indicator marks Monday opening prices and allows for analysis supported by Fibonacci levels. By using this indicator, you can shape your long-term investment strategies more consciously.
Always remember that, as with anything, making careful and informed decisions is crucial when investing. I hope this indicator helps you better navigate your long-term investments.
Note: Understanding market risks and utilizing analytical tools carefully is always important. Best of luck!
Today, I'd like to introduce you to an indicator called "3M Range" and explain how this indicator is calculated, as well as the kind of strategy it can offer.
What is the 3M Range Indicator?
"3M Range" is an analytical tool designed to identify and visualize market movements within three-month periods. This indicator employs specific levels and Fibonacci levels to assist investors in understanding market trends.
How is it Calculated?
The indicator utilizes the opening, highest, and lowest prices of three-month periods starting on Mondays. By using these prices, the indicator tracks weekly opening prices and marks the opening prices every Monday.
How Does the Indicator's Strategy Work?
Using this indicator, you can refine your long-term investment strategies:
Identify Three-Month Periods: The indicator follows the opening, highest, and lowest prices in three-month periods. This allows for a clearer understanding of long-term trends.
Utilize Fibonacci Levels: The indicator calculates Fibonacci levels to show support and resistance levels. These levels can help predict potential reversals or ongoing movements.
Observe Monday Opening Prices: The indicator distinctly marks Monday opening prices. This helps you capture potential movements at the beginning of the week.
Evaluate Trends and Opportunities: By using the indicator, you can observe long-term trends and potential market opportunities more clearly.
In Conclusion,
The "3M Range" indicator provides long-term investors with a better analytical tool by showcasing market movements within three-month periods. The indicator marks Monday opening prices and allows for analysis supported by Fibonacci levels. By using this indicator, you can shape your long-term investment strategies more consciously.
Always remember that, as with anything, making careful and informed decisions is crucial when investing. I hope this indicator helps you better navigate your long-term investments.
Note: Understanding market risks and utilizing analytical tools carefully is always important. Best of luck!
오픈 소스 스크립트
트레이딩뷰의 진정한 정신에 따라, 이 스크립트의 작성자는 이를 오픈소스로 공개하여 트레이더들이 기능을 검토하고 검증할 수 있도록 했습니다. 작성자에게 찬사를 보냅니다! 이 코드는 무료로 사용할 수 있지만, 코드를 재게시하는 경우 하우스 룰이 적용된다는 점을 기억하세요.
면책사항
해당 정보와 게시물은 금융, 투자, 트레이딩 또는 기타 유형의 조언이나 권장 사항으로 간주되지 않으며, 트레이딩뷰에서 제공하거나 보증하는 것이 아닙니다. 자세한 내용은 이용 약관을 참조하세요.
오픈 소스 스크립트
트레이딩뷰의 진정한 정신에 따라, 이 스크립트의 작성자는 이를 오픈소스로 공개하여 트레이더들이 기능을 검토하고 검증할 수 있도록 했습니다. 작성자에게 찬사를 보냅니다! 이 코드는 무료로 사용할 수 있지만, 코드를 재게시하는 경우 하우스 룰이 적용된다는 점을 기억하세요.
면책사항
해당 정보와 게시물은 금융, 투자, 트레이딩 또는 기타 유형의 조언이나 권장 사항으로 간주되지 않으며, 트레이딩뷰에서 제공하거나 보증하는 것이 아닙니다. 자세한 내용은 이용 약관을 참조하세요.