INVITE-ONLY SCRIPT
LQ Zones
LQ Zones – Volume Distribution Zone Detector
══════════════════════════════════════════
OVERVIEW
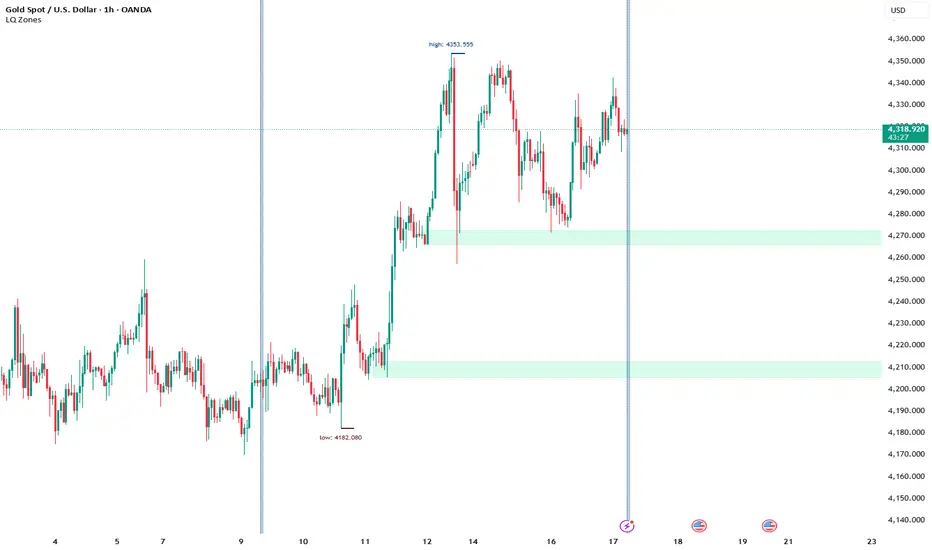
LQ Zones identifies potential liquidity accumulation areas by analyzing volume distribution across price levels within a user-defined time range. The indicator helps traders locate zones where concentrated trading activity may have occurred.
CORE CONCEPT
The indicator is based on Volume Profile analysis – examining how trading volume is distributed across different price levels rather than across time. Within your selected range, the algorithm identifies price levels where volume has concentrated and flags these as potential zones of interest.
WHAT MAKES IT DIFFERENT
Unlike standard Volume Profile indicators that display the entire distribution, LQ Zones focuses specifically on detecting stable accumulation areas – price levels where volume concentration persisted across multiple bars. These persistent zones are then filtered based on whether subsequent price action has revisited them.
HOW IT WORKS (General Logic)
1. User defines a time range using start and end boundaries
2. The indicator determines whether the selected range was predominantly bullish or bearish
3. Volume distribution across price levels is analyzed within that range
4. Zones where volume accumulated consistently are identified
5. Only zones that remain untested (not revisited by price) are displayed
ZONE PLACEMENT
- Bullish context: Zones appear below the main activity area
- Bearish context: Zones appear above the main activity area
This placement logic is based on the principle that accumulated positions create potential reaction areas in the direction opposite to their formation.
SETTINGS
- Start/End Time – Defines analysis boundaries
- Merge Distance – Combines nearby zones (in points)
- Show HH/LL – Displays range structure markers
- Zone Colors – Visual customization for bullish/bearish zones
LIMITATIONS
- Provides potential zones only – no stop-loss or take-profit levels
- No buy/sell signals generated
- Zone validity depends on user's time range selection
- Historical zones do not guarantee future price reactions
DISCLAIMER
This is an analytical tool for educational purposes. It does not constitute trading advice. Past performance does not indicate future results. Always use proper risk management.
══════════════════════════════════════════
OVERVIEW
LQ Zones identifies potential liquidity accumulation areas by analyzing volume distribution across price levels within a user-defined time range. The indicator helps traders locate zones where concentrated trading activity may have occurred.
CORE CONCEPT
The indicator is based on Volume Profile analysis – examining how trading volume is distributed across different price levels rather than across time. Within your selected range, the algorithm identifies price levels where volume has concentrated and flags these as potential zones of interest.
WHAT MAKES IT DIFFERENT
Unlike standard Volume Profile indicators that display the entire distribution, LQ Zones focuses specifically on detecting stable accumulation areas – price levels where volume concentration persisted across multiple bars. These persistent zones are then filtered based on whether subsequent price action has revisited them.
HOW IT WORKS (General Logic)
1. User defines a time range using start and end boundaries
2. The indicator determines whether the selected range was predominantly bullish or bearish
3. Volume distribution across price levels is analyzed within that range
4. Zones where volume accumulated consistently are identified
5. Only zones that remain untested (not revisited by price) are displayed
ZONE PLACEMENT
- Bullish context: Zones appear below the main activity area
- Bearish context: Zones appear above the main activity area
This placement logic is based on the principle that accumulated positions create potential reaction areas in the direction opposite to their formation.
SETTINGS
- Start/End Time – Defines analysis boundaries
- Merge Distance – Combines nearby zones (in points)
- Show HH/LL – Displays range structure markers
- Zone Colors – Visual customization for bullish/bearish zones
LIMITATIONS
- Provides potential zones only – no stop-loss or take-profit levels
- No buy/sell signals generated
- Zone validity depends on user's time range selection
- Historical zones do not guarantee future price reactions
DISCLAIMER
This is an analytical tool for educational purposes. It does not constitute trading advice. Past performance does not indicate future results. Always use proper risk management.
초대 전용 스크립트
이 스크립트는 작성자가 승인한 사용자만 접근할 수 있습니다. 사용하려면 요청 후 승인을 받아야 하며, 일반적으로 결제 후에 허가가 부여됩니다. 자세한 내용은 아래 작성자의 안내를 따르거나 Atabaki에게 직접 문의하세요.
트레이딩뷰는 스크립트의 작동 방식을 충분히 이해하고 작성자를 완전히 신뢰하지 않는 이상, 해당 스크립트에 비용을 지불하거나 사용하는 것을 권장하지 않습니다. 커뮤니티 스크립트에서 무료 오픈소스 대안을 찾아보실 수도 있습니다.
작성자 지시 사항
To request access, send me a Private Message. Do not request access in the comments section.
📩 Contact: @fastchart (Telegram)
면책사항
해당 정보와 게시물은 금융, 투자, 트레이딩 또는 기타 유형의 조언이나 권장 사항으로 간주되지 않으며, 트레이딩뷰에서 제공하거나 보증하는 것이 아닙니다. 자세한 내용은 이용 약관을 참조하세요.