OPEN-SOURCE SCRIPT
업데이트됨 Bitcoin Fair Price Calculator [bitcoinfairprice.com]
1. Purpose of the scriptLong-term Bitcoin valuation based on historical time (days since Genesis block)
Fair Price = theoretically “fair” price according to power law.
Bottom Price = lower support (historically ~58% below Fair Price).
Daily display as on the website – without external access.
Buy/sell signals in case of strong overvaluation/undervaluation.
2. Mathematical model (original formula)pinescript
Bottom Price = Fair Price × 0.42
→ Corresponds historically to ~58% below Fair Price.
Days since Genesis block are calculated automatically per bar.
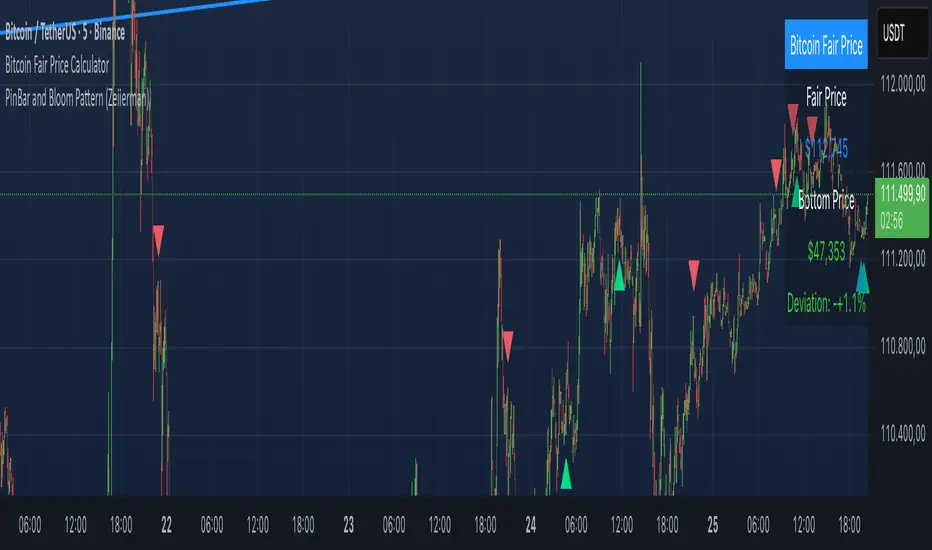
3. What is displayed in the chart?
Fair Price Average power law line (“fair price”) Blue
Bottom Price Lower support (“floor”) Green
Power Law Corridor Filled area between 0.1× and 2.5× Fair Price Light blue (transparent)
Table (top right) Daily values as on the website Black with white text
Label (for >20% deviation) Shows current prices + percentage Red (overvalued) / Green (undervalued)
4. Recommended use Timeframe
Recommendation Weekly / Monthly Best long-term signals
Daily Good balance
Log scale Be sure to activate! (Right-click on Y-axis → “Logarithmic scale”)
9. Strategy tips (based on the model)
Price near bottom --> Buy / accumulate
Price > 2.5× fair price --> Sell part of position / caution
Price between fair & bottom --> Strong buy zone
Deviation < -20% --> HODL signal
Translated with DeepL.com (free version)
Fair Price = theoretically “fair” price according to power law.
Bottom Price = lower support (historically ~58% below Fair Price).
Daily display as on the website – without external access.
Buy/sell signals in case of strong overvaluation/undervaluation.
2. Mathematical model (original formula)pinescript
Bottom Price = Fair Price × 0.42
→ Corresponds historically to ~58% below Fair Price.
Days since Genesis block are calculated automatically per bar.
3. What is displayed in the chart?
Fair Price Average power law line (“fair price”) Blue
Bottom Price Lower support (“floor”) Green
Power Law Corridor Filled area between 0.1× and 2.5× Fair Price Light blue (transparent)
Table (top right) Daily values as on the website Black with white text
Label (for >20% deviation) Shows current prices + percentage Red (overvalued) / Green (undervalued)
4. Recommended use Timeframe
Recommendation Weekly / Monthly Best long-term signals
Daily Good balance
Log scale Be sure to activate! (Right-click on Y-axis → “Logarithmic scale”)
9. Strategy tips (based on the model)
Price near bottom --> Buy / accumulate
Price > 2.5× fair price --> Sell part of position / caution
Price between fair & bottom --> Strong buy zone
Deviation < -20% --> HODL signal
Translated with DeepL.com (free version)
릴리즈 노트
1. Purpose of the scriptLong-term Bitcoin valuation based on historical time (days since Genesis block)Fair Price = theoretically “fair” price according to power law.
Bottom Price = lower support (historically ~58% below Fair Price).
Daily display as on the website – without external access.
Buy/sell signals in case of strong overvaluation/undervaluation.
2. Mathematical model (original formula)pinescript
Bottom Price = Fair Price × 0.42
→ Corresponds historically to ~58% below Fair Price.
Days since Genesis block are calculated automatically per bar.
3. What is displayed in the chart?
Fair Price Average power law line (“fair price”) Blue
Bottom Price Lower support (“floor”) Green
Power Law Corridor Filled area between 0.1× and 2.5× Fair Price Light blue (transparent)
Table (top right) Daily values as on the website Black with white text
Label (for >20% deviation) Shows current prices + percentage Red (overvalued) / Green (undervalued)
4. Recommended use Timeframe
Recommendation Weekly / Monthly Best long-term signals
Daily Good balance
Log scale Be sure to activate! (Right-click on Y-axis → “Logarithmic scale”)
5. Strategy tips (based on the model)
Price near bottom --> Buy / accumulate
Price > 2.5× fair price --> Sell part of position / caution
Price between fair & bottom --> Strong buy zone
Deviation < -20% --> HODL signal
오픈 소스 스크립트
진정한 트레이딩뷰 정신에 따라 이 스크립트 작성자는 트레이더가 기능을 검토하고 검증할 수 있도록 오픈소스로 공개했습니다. 작성자에게 찬사를 보냅니다! 무료로 사용할 수 있지만 코드를 다시 게시할 경우 하우스 룰이 적용된다는 점을 기억하세요.
면책사항
이 정보와 게시물은 TradingView에서 제공하거나 보증하는 금융, 투자, 거래 또는 기타 유형의 조언이나 권고 사항을 의미하거나 구성하지 않습니다. 자세한 내용은 이용 약관을 참고하세요.
오픈 소스 스크립트
진정한 트레이딩뷰 정신에 따라 이 스크립트 작성자는 트레이더가 기능을 검토하고 검증할 수 있도록 오픈소스로 공개했습니다. 작성자에게 찬사를 보냅니다! 무료로 사용할 수 있지만 코드를 다시 게시할 경우 하우스 룰이 적용된다는 점을 기억하세요.
면책사항
이 정보와 게시물은 TradingView에서 제공하거나 보증하는 금융, 투자, 거래 또는 기타 유형의 조언이나 권고 사항을 의미하거나 구성하지 않습니다. 자세한 내용은 이용 약관을 참고하세요.