PROTECTED SOURCE SCRIPT
Pivot Connect
Pivot Connect –
a condensed and educational version
Objective
Automatically draws extended horizontal lines at the pivots (relevant highs and lows) of three timeframes:
The current chart (1 min, 5 min, 1 h… whatever you're looking at)
Weekly (W)
4-hour (240 min)
These lines are considered "protected levels": resistances (highs) or supports (lows).
The script also detects when the price breaks only the wick break to change the color/style of the line and warn that the level may have become invalid.
What is a pivot here?
ta.pivothigh / ta.pivotlow calculate a local high/low that has at least n bars on either side.
The pivotStrength parameter (default 12) is that n.
Therefore, a pivot high requires 12 candles to the left and 12 to the right lower than itself.
Lines drawn:
Highs and lows of the current timeframe (red and green)
Weekly highs and lows (blue and orange) if useWeekly = true
4-hour highs and lows (fuchsia and aqua) if use4H = true
Each line extends to the right by "extendLines" bars (default 100).
Wick break
This is reviewed bar by bar:
For a High level: if the high breaks above the line but the close remains below → it is considered a false break (wick break) and the line changes to purple and dashed style.
For a Low level: if the low breaks above the line but the close remains above → same warning.
The wickBreakBars (5) parameter is not used in the current logic; it was probably intended for future validation.
Cleaning Old Lines
Every 100 bars, lines with a right end older than 500 bars are removed to avoid memory overload (max_lines_count = 500).
Quick Customization
Colors and styles for each category.
Show or hide each line group (showHighs, showLows, useWeekly, use4H).
Thickness, solid/dash/dotted style.
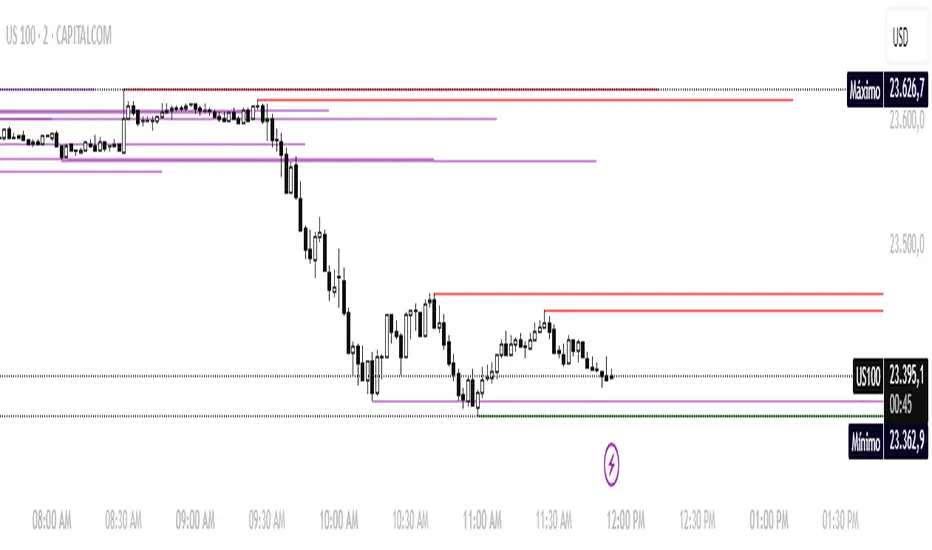
Example of on-screen reading
Horizontal red line: resistance of the timeframe itself.
Horizontal blue line: important weekly high.
If a line changes to dashed purple: the price pierced it with the wick but did not close above it (at highs) – possible rejection.
This gives you a visual map of multi-timeframe support and resistance levels with quick alerts for "suspicious" breakouts.
a condensed and educational version
Objective
Automatically draws extended horizontal lines at the pivots (relevant highs and lows) of three timeframes:
The current chart (1 min, 5 min, 1 h… whatever you're looking at)
Weekly (W)
4-hour (240 min)
These lines are considered "protected levels": resistances (highs) or supports (lows).
The script also detects when the price breaks only the wick break to change the color/style of the line and warn that the level may have become invalid.
What is a pivot here?
ta.pivothigh / ta.pivotlow calculate a local high/low that has at least n bars on either side.
The pivotStrength parameter (default 12) is that n.
Therefore, a pivot high requires 12 candles to the left and 12 to the right lower than itself.
Lines drawn:
Highs and lows of the current timeframe (red and green)
Weekly highs and lows (blue and orange) if useWeekly = true
4-hour highs and lows (fuchsia and aqua) if use4H = true
Each line extends to the right by "extendLines" bars (default 100).
Wick break
This is reviewed bar by bar:
For a High level: if the high breaks above the line but the close remains below → it is considered a false break (wick break) and the line changes to purple and dashed style.
For a Low level: if the low breaks above the line but the close remains above → same warning.
The wickBreakBars (5) parameter is not used in the current logic; it was probably intended for future validation.
Cleaning Old Lines
Every 100 bars, lines with a right end older than 500 bars are removed to avoid memory overload (max_lines_count = 500).
Quick Customization
Colors and styles for each category.
Show or hide each line group (showHighs, showLows, useWeekly, use4H).
Thickness, solid/dash/dotted style.
Example of on-screen reading
Horizontal red line: resistance of the timeframe itself.
Horizontal blue line: important weekly high.
If a line changes to dashed purple: the price pierced it with the wick but did not close above it (at highs) – possible rejection.
This gives you a visual map of multi-timeframe support and resistance levels with quick alerts for "suspicious" breakouts.
보호된 스크립트입니다
이 스크립트는 비공개 소스로 게시됩니다. 하지만 이를 자유롭게 제한 없이 사용할 수 있습니다 – 자세한 내용은 여기에서 확인하세요.
Te enseño a perder dignamente.. Luego te digo el porque... Paciencia
면책사항
해당 정보와 게시물은 금융, 투자, 트레이딩 또는 기타 유형의 조언이나 권장 사항으로 간주되지 않으며, 트레이딩뷰에서 제공하거나 보증하는 것이 아닙니다. 자세한 내용은 이용 약관을 참조하세요.
보호된 스크립트입니다
이 스크립트는 비공개 소스로 게시됩니다. 하지만 이를 자유롭게 제한 없이 사용할 수 있습니다 – 자세한 내용은 여기에서 확인하세요.
Te enseño a perder dignamente.. Luego te digo el porque... Paciencia
면책사항
해당 정보와 게시물은 금융, 투자, 트레이딩 또는 기타 유형의 조언이나 권장 사항으로 간주되지 않으며, 트레이딩뷰에서 제공하거나 보증하는 것이 아닙니다. 자세한 내용은 이용 약관을 참조하세요.