INVITE-ONLY SCRIPT
업데이트됨 PPP – Info Table (Anchor + Corr/Alpha/Beta) v3
PPP – Info Table (Anchor + Corr/Alpha/Beta)
- By P3 Analytics, run by Puranam Pradeep Picasso Sharma
🔎 Overview
This indicator creates a clean, dynamic information table on your chart that lets you quickly analyze how your chosen asset is performing relative to BTC, ETH, or any other benchmarks.
With a single glance, you can see:
Perfect for traders who want to measure coin strength vs benchmarks and make better rotation, risk, or hedging decisions.
📊 Key Metrics
Correlation (Corr): How closely the asset moves with the benchmark.
Beta (β): Sensitivity of returns vs the benchmark.
Alpha (α): Excess return beyond what Beta predicts.
⚙️ Features
Flexible Anchor Mode:
Bars Back → quickly step through bars.
Time → pin analysis to a specific historical candle.
Customizable Benchmarks: Default BTC & ETH (futures), but replaceable with any ticker.
Adjustable Stats Window:
1 Week, 1 Month, 1 Year (auto-scales if using chart timeframe).
Compact Mode for a smaller table layout.
Dark/Light Theme, font size, corner placement, transparency, and decimal control.
Runs efficiently with minimal chart clutter.
🧑💻 About P3 Analytics
This indicator is developed under P3 Analytics, a research & trading technology initiative led by Puranam Pradeep Picasso Sharma.
P3 Analytics builds tools that merge machine learning, statistics, and trading strategy into accessible products for traders across crypto, equities, forex, and commodities.
✅ How to Use
Add indicator to your chart.
In settings:
Pick your benchmarks (default = BTCUSDT.P, ETHUSDT.P).
Choose your anchor (Bars Back or Time).
Set window length for correlation/alpha/beta.
Read the table:
Left side = your asset.
Right side = benchmarks.
Colors: Green = positive % change, Red = negative.
🚀 Why Use This?
Quickly compare your asset vs BTC/ETH without juggling multiple charts.
Spot whether a coin is truly leading or just following BTC.
Identify outperformance (alpha) coins for rotation or trend plays.
Manage risk by knowing which assets are high beta (high leverage-like moves).
✦ Indicator by P3 Analytics
✦ Created & published by Puranam Pradeep Picasso Sharma
- By P3 Analytics, run by Puranam Pradeep Picasso Sharma
🔎 Overview
This indicator creates a clean, dynamic information table on your chart that lets you quickly analyze how your chosen asset is performing relative to BTC, ETH, or any other benchmarks.
With a single glance, you can see:
- % change from today’s open (for the anchor asset, BTC, and ETH)
- Previous day % change (self + benchmarks)
- Correlation, Beta, and Alpha statistics for the selected window (1W, 1M, 1Y)
- Anchor values at any bar you choose (via Bars Back or Anchor Time)
Perfect for traders who want to measure coin strength vs benchmarks and make better rotation, risk, or hedging decisions.
📊 Key Metrics
Correlation (Corr): How closely the asset moves with the benchmark.
- +1 = moves together, 0 = no relation, -1 = moves opposite.
Beta (β): Sensitivity of returns vs the benchmark.
- β = 1 → moves 1:1 with BTC.
- β > 1 → more volatile (amplifies BTC moves).
- β < 1 → less volatile (defensive).
Alpha (α): Excess return beyond what Beta predicts.
- Positive α = outperforming benchmark-adjusted expectation.
- Negative α = underperforming.
⚙️ Features
Flexible Anchor Mode:
Bars Back → quickly step through bars.
Time → pin analysis to a specific historical candle.
Customizable Benchmarks: Default BTC & ETH (futures), but replaceable with any ticker.
Adjustable Stats Window:
1 Week, 1 Month, 1 Year (auto-scales if using chart timeframe).
Compact Mode for a smaller table layout.
Dark/Light Theme, font size, corner placement, transparency, and decimal control.
Runs efficiently with minimal chart clutter.
🧑💻 About P3 Analytics
This indicator is developed under P3 Analytics, a research & trading technology initiative led by Puranam Pradeep Picasso Sharma.
P3 Analytics builds tools that merge machine learning, statistics, and trading strategy into accessible products for traders across crypto, equities, forex, and commodities.
✅ How to Use
Add indicator to your chart.
In settings:
Pick your benchmarks (default = BTCUSDT.P, ETHUSDT.P).
Choose your anchor (Bars Back or Time).
Set window length for correlation/alpha/beta.
Read the table:
Left side = your asset.
Right side = benchmarks.
Colors: Green = positive % change, Red = negative.
🚀 Why Use This?
Quickly compare your asset vs BTC/ETH without juggling multiple charts.
Spot whether a coin is truly leading or just following BTC.
Identify outperformance (alpha) coins for rotation or trend plays.
Manage risk by knowing which assets are high beta (high leverage-like moves).
✦ Indicator by P3 Analytics
✦ Created & published by Puranam Pradeep Picasso Sharma
릴리즈 노트
Added, 5 day previous performance of the asset for ease of assessment.릴리즈 노트
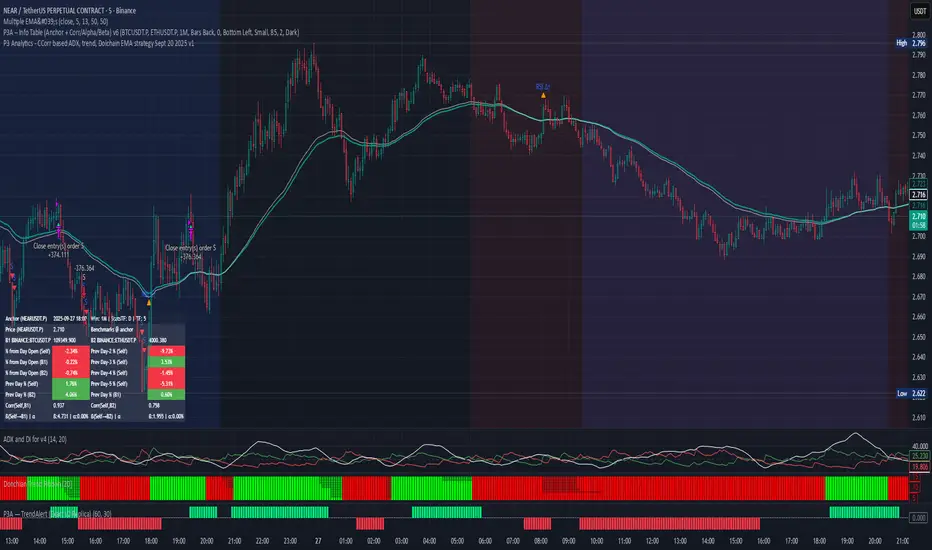
# P3A – Info Table (Anchor + Corr/Alpha/Beta) v6A fast, lightweight **context dashboard** for any chart. **Anchor** the table to any bar (by *Bars Back* or exact *Time*) and instantly read:
* Price at the anchor (self + two benchmarks)
* **% from Day Open** at that anchor (self + benchmarks)
* **Previous-day % change** (self + benchmarks) + **Day-2/3/4/5** for self
* Rolling **Correlation ρ**, **Beta β**, and **Alpha α** over a selectable window (1W / 1M / 1Y), computed on **Daily** returns or **Chart Timeframe** returns
Built for **relative strength**, **risk framing**, **pair ideas**, and **post-event analysis**—without cluttering your chart.
---
## What’s new in v6
* Updated to **Pine Script® v6** (stable performance, latest syntax)
* UI polish: **Dark/Light** theme, **Compact mode**, corner placement, percent decimals, transparency
* Option to compute stats on either **Daily** returns *(cleaner)* or **current chart TF** *(more reactive)*
---
## Why traders use this
**Context at a glance**
* See how your symbol behaved **at a specific moment** (news, breakout, session open) and compare it to two benchmarks.
* Check **if strength/weakness was broad** (benchmarks also strong/weak) or **idiosyncratic** (only your symbol moved).
**Relative strength & risk reading**
* **α (Alpha)**: average **excess** return vs. benchmark after accounting for β.
Positive α → consistent outperformance; negative α → drag.
* **β (Beta)**: sensitivity vs. benchmark.
β≈1 → tracks the benchmark; β>1 → amplified moves; β<1 → damped moves.
* **ρ (Correlation)**: regime feel.
High ρ → coupled; low/negative ρ → diversification or pair setups.
**Time-travel sanity checks**
* Lock the table to the exact bar you care about and **freeze the numbers** (no hunting through data windows).
---
## Inputs & Settings (quick guide)
**Benchmarks**
* `Benchmark 1` & `Benchmark 2`: any symbols (e.g., BTC & ETH, SPX & QQQ, NIFTY & BANKNIFTY, DXY & GOLD).
**Stats Window (What are Alpha/Beta?)**
* `Window Length`: 1W ≈ 7 days, 1M ≈ 30 days, 1Y ≈ 365 days.
* `Use Chart Timeframe Returns (else Daily)`:
* **OFF (Daily)**: smoother α/β/ρ; good for swing/position context.
* **ON (Chart TF)**: more reactive; good for day/short-term context.
The script auto-converts the period into bars on your TF (with a minimum guard).
**Anchor Selection**
* `Anchor Mode`: **Bars Back** or **Time** (exchange time).
* `Bars Back`: 0 = current bar; use ↑/↓ to step quickly.
* `Anchor Time`: exact timestamp; if no exact match, we use the latest bar **before** that time.
**Table & Display**
* `Corner`, `Text Size`, `Theme`, `Transparency`, `Percent Decimals`, `Compact Mode`.
---
## How to read the table
* **Header**: shows the symbol, anchored date/time, chosen window, stats timeframe (D or your chart TF).
* **Prices at Anchor**: price of your symbol + both benchmarks on the anchor bar.
* **% from Day Open**: intraday performance at the anchor. Green/red cells reflect sign of change.
* **Prev Day % (and Day-2/3/4/5 for self)**: the day-over-day context before the anchor day.
* **Correlation (ρ)**: −1 to +1 (opposite to coupled).
* **Beta (β) | Alpha (α)**: β printed as a number; α printed as a percentage (annualization not applied—this is average per-bar return on the chosen stats TF).
---
## Practical use-cases
**1) Rotation & Selection**
* Goal: Find steady outperformers.
* Look for **α > 0** with a **β** you’re comfortable sizing (e.g., 0.6–1.2). If ρ is reasonably stable, the outperformance may be structural.
**2) Pair / Relative-value ideas**
* Goal: Trade spreads or hedges.
* If **ρ is low or negative** and **α is persistently positive** vs. a benchmark, the symbol may diverge in a tradeable way.
**3) Event & Session Audits**
* Goal: Measure the effect of news or session opens.
* Anchor on the news candle (or session open). Check **% from Day Open** (self + benchmarks).
Broad green? Risk-on. Only self green? Stock-specific catalyst.
**4) Risk-Regime Checks**
* Goal: Size positions smartly.
* Rising **β** + high **ρ** → tighter coupling and higher swing risk → adjust size or hedge.
* Falling **ρ** → diversification benefit (your symbol decoupling from the benchmark).
---
## Examples
**Crypto (Alt vs. BTC)**
* Benchmarks: `B1 = BINANCE:BTCUSDT.P`, `B2 = BINANCE:ETHUSDT.P`.
* Window: **1M**, Returns: **Daily**.
* Anchor on last big breakout.
* If **α>0** vs. BTC and **β≈1.1** with **ρ>0.6**, your alt is a slightly higher-beta outperformer—candidate for rotation if market remains constructive.
**Equities (Stock vs. Index)**
* Benchmarks: `B1 = SP:SPX`, `B2 = NASDAQ:NDX`.
* Window: **1W**, Returns: **Chart TF = 15m** during earnings week.
* Anchor at earnings candle time.
* If **% from Day Open** (stock) >> benchmarks, but **ρ** drops and **β** spikes, strength may be idiosyncratic—and risk is higher (vol-of-vol).
**India (Sector Tilt)**
* Benchmarks: `B1 = NSE:NIFTY`, `B2 = NSE:BANKNIFTY`.
* Window: **1M**, Returns: **Daily**.
* Track **α** for a sector leader; if α remains positive while **β** trends down (same performance with lower sensitivity), you’ve got efficient outperformance.
---
## Tips & Best Practices
* **Choose meaningful benchmarks**: sector index or macro driver that truly explains your symbol’s risk.
* **Daily vs. Chart TF**: prefer **Daily** for cleaner signal. Switch to **Chart TF** when you need intraday reactivity.
* **Window length**: shorter windows react faster but can be noisy; longer windows are steadier but slower to adapt.
* **Anchor smartly**: use it on pivots—breakouts, failed breaks, macro announcements—to compare outcomes fairly.
* **Combine with structure**: α/β/ρ add context; let your entries/exits still come from price structure, volume, and your system rules.
---
## Notes & Limitations
* Stats are **historical at the anchor**; this is an **information tool**, not a signal generator.
* **α** shown is average excess return for the selected series of bars, not an annualized metric.
* Extremely low-liquidity symbols or sparse histories can produce noisy or `na` stats.
* Very small chart timeframes with short windows can be jittery—lengthen the window or use Daily.
---
## Credits & License
* **Author**: P3 Analytics — *Puranam Pradeep “Picasso” Sharma*
* **License**: Mozilla Public License 2.0
* Thanks to the TradingView team & community for Pine Script® v6.
---
## Changelog
**v6**
* Migrated to Pine v6
* Improved styling (themes, compact mode, transparency, decimals)
* Option to compute stats on **Daily or Chart TF** returns
* Safer handling of missing bars and table rebuilds
초대 전용 스크립트
이 스크립트는 작성자가 승인한 사용자만 접근할 수 있습니다. 사용하려면 요청 후 승인을 받아야 하며, 일반적으로 결제 후에 허가가 부여됩니다. 자세한 내용은 아래 작성자의 안내를 따르거나 picasso9999에게 직접 문의하세요.
트레이딩뷰는 스크립트의 작동 방식을 충분히 이해하고 작성자를 완전히 신뢰하지 않는 이상, 해당 스크립트에 비용을 지불하거나 사용하는 것을 권장하지 않습니다. 커뮤니티 스크립트에서 무료 오픈소스 대안을 찾아보실 수도 있습니다.
작성자 지시 사항
Hi!
For those who want the pinescript code for the same, can contact me @ https://www.patreon.com/c/pppicasso or can check out the products Shop page for purchase. I usually respond within 24-48 hours. Thank you.
Regards,
Puranam Pradeep Picasso Sharma
Puranam Pradeep Picasso Sharma
면책사항
해당 정보와 게시물은 금융, 투자, 트레이딩 또는 기타 유형의 조언이나 권장 사항으로 간주되지 않으며, 트레이딩뷰에서 제공하거나 보증하는 것이 아닙니다. 자세한 내용은 이용 약관을 참조하세요.