INVITE-ONLY SCRIPT
Bull-Bear Pressure
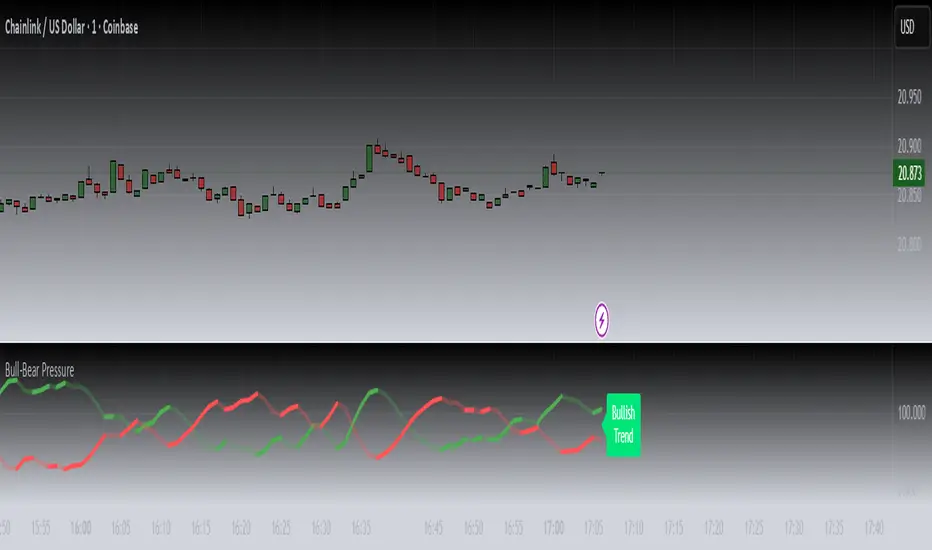
BULL-BEAR PRESSURE
Uniqueness
Bull-Bear Pressure measures the live tug-of-war between bullish and bearish momentum by transforming internal engine data into a visual gauge of market pressure.
How It Works
The indicator processes dual data feeds — one representing bullish pressure and the other bearish pressure. These values update in real time showing how pressure dynamics are currently distributed and highlighting areas where momentum dynamics may be adjusting.
Usefulness
By monitoring pressure dynamics, traders gain context on whether moves are supported by strong participation or fading momentum. It adds depth to directional bias especially when viewing multiple timeframe charts side by side.
How to Use It
Overlay Bull-Bear Pressure on your chart and compare shifts in bullish vs bearish strength. Use it underneath multi-timeframe or forecast-style indicators for added context.
Disclaimer
This indicator produces visual and informational outputs only. It does not generate trade signals, entry/exit rules, or backtestable strategies. The tool is intended purely as an educational resource to help users interpret market behavior. It does not constitute financial advice, and past performance does not guarantee future results. Trading involves risk, and you may lose some or all of your investment.
Release Notes:
v1.0 (Initial Release)
초대 전용 스크립트
이 스크립트는 작성자가 승인한 사용자만 접근할 수 있습니다. 사용하려면 요청 후 승인을 받아야 하며, 일반적으로 결제 후에 허가가 부여됩니다. 자세한 내용은 아래 작성자의 안내를 따르거나 Predator-Trading-Systems에게 직접 문의하세요.
트레이딩뷰는 스크립트의 작동 방식을 충분히 이해하고 작성자를 완전히 신뢰하지 않는 이상, 해당 스크립트에 비용을 지불하거나 사용하는 것을 권장하지 않습니다. 커뮤니티 스크립트에서 무료 오픈소스 대안을 찾아보실 수도 있습니다.
작성자 지시 사항
Get access here: https://predatortradingsystems.com/
면책사항
해당 정보와 게시물은 금융, 투자, 트레이딩 또는 기타 유형의 조언이나 권장 사항으로 간주되지 않으며, 트레이딩뷰에서 제공하거나 보증하는 것이 아닙니다. 자세한 내용은 이용 약관을 참조하세요.