OPEN-SOURCE SCRIPT
Oracle Fear and Greed
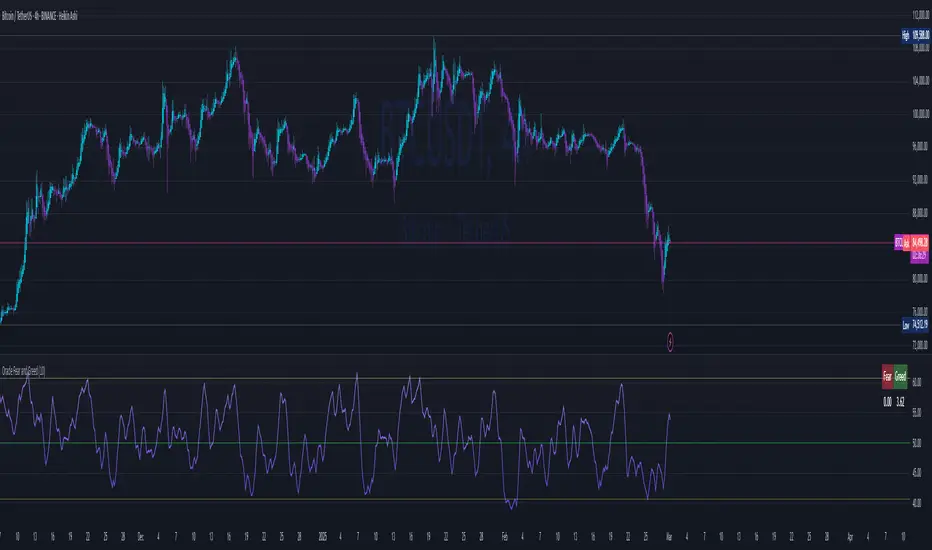
Custom Fear and Greed Oscillator with Movement Table
This indicator provides a unique perspective on market sentiment by calculating a custom fear/greed oscillator based on Heikin-Ashi candles. The oscillator is centered at 50, with values above 50 suggesting bullish sentiment ("greed") and below 50 indicating bearish sentiment ("fear"). The calculation incorporates candle body size, range, and a custom "candle strength" measure, providing an innovative approach to understanding market behavior.
Key Features:
Heikin-Ashi Based Oscillator:
Utilizes Heikin-Ashi candles to compute a custom oscillator. The value is centered at 50, with deviations indicating the prevailing market sentiment.
Dynamic Gradient Coloring:
The oscillator line is dynamically colored with a smooth gradient—from blue (representing fear) at lower values to pink (representing greed) at higher values—making it visually intuitive.
Horizontal Levels:
Two additional horizontal lines are drawn at 40.62 ("Bottom") and 60.74 ("Top"), which may serve as potential oversold and overbought boundaries respectively.
Fast Movement Metrics:
Every 5 bars, the indicator calculates the percentage change in the Heikin-Ashi close. This fast movement analysis distinguishes rapid downward moves (fast fear) from rapid upward moves (fast greed), helping to capture sudden market shifts.
Information Table:
A table in the top-right corner displays the most recent fast movement values for both fear and greed, offering quick insights into short-term market dynamics.
Usage Tips:
Adjust the smoothing period to match your preferred trading timeframe.
Use the oscillator alongside other analysis tools for more robust trading decisions.
Ideal for those looking to experiment with new approaches to sentiment analysis and momentum detection.
Disclaimer:
This indicator is intended for educational and experimental purposes. It should not be used as the sole basis for any trading decisions. Always combine with comprehensive market analysis and risk management strategies.
You can add this description when publishing your indicator on TradingView to help other users understand its features and intended use.
오픈 소스 스크립트
트레이딩뷰의 진정한 정신에 따라, 이 스크립트의 작성자는 이를 오픈소스로 공개하여 트레이더들이 기능을 검토하고 검증할 수 있도록 했습니다. 작성자에게 찬사를 보냅니다! 이 코드는 무료로 사용할 수 있지만, 코드를 재게시하는 경우 하우스 룰이 적용된다는 점을 기억하세요.
// (\_/)
// ( •.•)
// (")_(")
// ( •.•)
// (")_(")
면책사항
해당 정보와 게시물은 금융, 투자, 트레이딩 또는 기타 유형의 조언이나 권장 사항으로 간주되지 않으며, 트레이딩뷰에서 제공하거나 보증하는 것이 아닙니다. 자세한 내용은 이용 약관을 참조하세요.