PINE LIBRARY
hinton_map
█ HINTON MAP
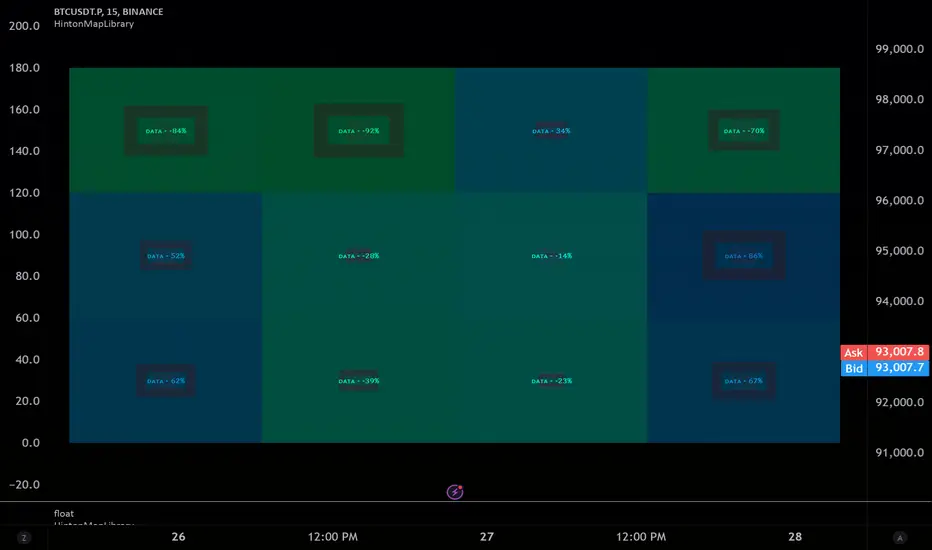
This library provides functions to create and display a Hinton Map visualization. A Hinton map uses squares to represent the magnitude and direction of values in a matrix. This library allows you to display multiple ticker/timeframe/indicator combinations on a single chart, using color/boxsize/bnordersize to represent the values used. The values must be from -1.0 to 1.0 in value. 3 different values can be input per square.
Example Usage:
The example below demonstrates how to create a Hinton Map for two symbols (AAPL and MSFT) across three timeframes (1 minute, 5 minutes, and 1 day).
Pine Script®
█ createHintonUnit
Creates a Hinton unit.
•fillValue
Value to determine the fill color hue.
Type: float
Default Value: 0.0
•borderValue
Value to determine the border color hue and width.
Type: float
Default Value: 0.0
•innerValue
Value to determine the inner box color hue.
Type: float
Default Value: 0.0
•boxText
Text to display in the inner box.
Type: dv.DisplayValue
Default Value: na
•tooltipText
Tooltip text for the inner box.
Type: dv.DisplayValue
Default Value: na
Returns: HintonUnit
█ initHintonData
Initializes Hinton map data structure.
•rows
Number of rows.
Type: int
•columns
Number of columns.
Type: int
Returns: HintonData
█ drawHintonMap
Draws a Hinton map.
•hintonData
Hinton map data.
Type: HintonData
•unitSize
Size of each unit in bars.
Type: int
Default Value: 10
•borderWidth
Base width of the inner box border.
Type: int
Default Value: 5
•plusHue
Hue value for positive values (0-360).
Type: float
Default Value: 180
•minusHue
Hue value for negative values (0-360).
Type: float
Default Value: -30
█ HintonUnit
Data for a Hinton unit.
•fillValue
Value to determine the fill color hue.
Type: float
•borderValue
Value to determine the border color hue and width.
Type: float
•innerValue
Value to determine the inner box color hue.
Type: float
•boxText
Text to display in the inner box.
Type: dv.DisplayValue
•tooltipText
Tooltip text for the inner box.
Type: dv.DisplayValue
█ HintonData
Structure to store Hinton map data.
•unitMatrix
Matrix of Hinton units.
Type: matrix<HintonUnit>
•lineMatrix
Matrix of lines.
Type: matrix<line>
•labelMatrix
Matrix of labels.
Type: matrix<label>
•boxMatrix
Matrix of boxes.
Type: matrix<box>
•fillMatrix
Matrix of line fills.
Type: matrix<linefill>
This library provides functions to create and display a Hinton Map visualization. A Hinton map uses squares to represent the magnitude and direction of values in a matrix. This library allows you to display multiple ticker/timeframe/indicator combinations on a single chart, using color/boxsize/bnordersize to represent the values used. The values must be from -1.0 to 1.0 in value. 3 different values can be input per square.
Example Usage:
The example below demonstrates how to create a Hinton Map for two symbols (AAPL and MSFT) across three timeframes (1 minute, 5 minutes, and 1 day).
var hintonData = hinton_map.initHintonData(2, 3)
tickers = array.from("AAPL", "MSFT")
timeframes = array.from("1", "5", "1D")
for i = 0 to array.size(tickers) - 1
for j = 0 to array.size(timeframes) - 1
ticker = array.get(tickers, i)
timeframe = array.get(timeframes, j)
[close_current, close_previous, rsi_current] = request.security(ticker, timeframe, [close, close[1], ta.rsi(close, 14)], lookahead = barmerge.lookahead_on)
percent_change = (close_current - close_previous) / close_previous * 100
rsi_deviation = rsi_current - 50
hintonData.unitMatrix.set(i, j, hinton_map.createHintonUnit(
fillValue = percent_change,
borderValue = rsi_deviation,
innerValue = percent_change * rsi_deviation,
boxText = dv.from_string(str.tostring(math.round(percent_change, 2)) + "%"),
tooltipText = dv.from_string(syminfo.ticker + ", " + timeframe + ": " + str.tostring(math.round(percent_change, 2)) + "%, RSI: " + str.tostring(math.round(rsi_current, 2)))
))
hinton_map.drawHintonMap(hintonData)
█ createHintonUnit
Creates a Hinton unit.
•fillValue
Value to determine the fill color hue.
Type: float
Default Value: 0.0
•borderValue
Value to determine the border color hue and width.
Type: float
Default Value: 0.0
•innerValue
Value to determine the inner box color hue.
Type: float
Default Value: 0.0
•boxText
Text to display in the inner box.
Type: dv.DisplayValue
Default Value: na
•tooltipText
Tooltip text for the inner box.
Type: dv.DisplayValue
Default Value: na
Returns: HintonUnit
█ initHintonData
Initializes Hinton map data structure.
•rows
Number of rows.
Type: int
•columns
Number of columns.
Type: int
Returns: HintonData
█ drawHintonMap
Draws a Hinton map.
•hintonData
Hinton map data.
Type: HintonData
•unitSize
Size of each unit in bars.
Type: int
Default Value: 10
•borderWidth
Base width of the inner box border.
Type: int
Default Value: 5
•plusHue
Hue value for positive values (0-360).
Type: float
Default Value: 180
•minusHue
Hue value for negative values (0-360).
Type: float
Default Value: -30
█ HintonUnit
Data for a Hinton unit.
•fillValue
Value to determine the fill color hue.
Type: float
•borderValue
Value to determine the border color hue and width.
Type: float
•innerValue
Value to determine the inner box color hue.
Type: float
•boxText
Text to display in the inner box.
Type: dv.DisplayValue
•tooltipText
Tooltip text for the inner box.
Type: dv.DisplayValue
█ HintonData
Structure to store Hinton map data.
•unitMatrix
Matrix of Hinton units.
Type: matrix<HintonUnit>
•lineMatrix
Matrix of lines.
Type: matrix<line>
•labelMatrix
Matrix of labels.
Type: matrix<label>
•boxMatrix
Matrix of boxes.
Type: matrix<box>
•fillMatrix
Matrix of line fills.
Type: matrix<linefill>
파인 라이브러리
트레이딩뷰의 진정한 정신에 따라, 작성자는 이 파인 코드를 오픈소스 라이브러리로 게시하여 커뮤니티의 다른 파인 프로그래머들이 재사용할 수 있도록 했습니다. 작성자에게 경의를 표합니다! 이 라이브러리는 개인적으로 사용하거나 다른 오픈소스 게시물에서 사용할 수 있지만, 이 코드의 게시물 내 재사용은 하우스 룰에 따라 규제됩니다.
면책사항
해당 정보와 게시물은 금융, 투자, 트레이딩 또는 기타 유형의 조언이나 권장 사항으로 간주되지 않으며, 트레이딩뷰에서 제공하거나 보증하는 것이 아닙니다. 자세한 내용은 이용 약관을 참조하세요.