OPEN-SOURCE SCRIPT
Session Volume Spike Detector (MTF Arrows)
Overview
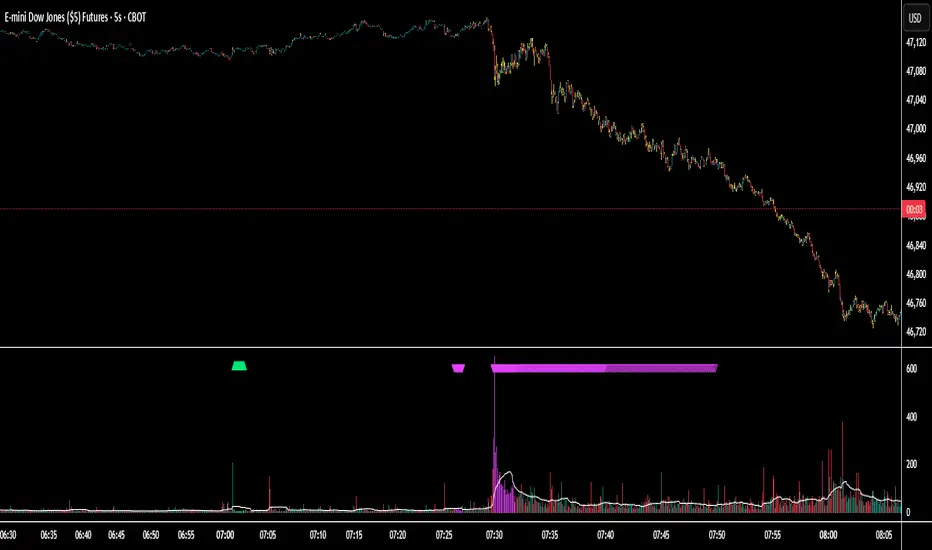
The Session Volume Spike Detector is a precision multi-timeframe (MTF) tool that identifies sudden surges in buy or sell volume during key market windows. It highlights high-impact institutional participation by comparing current volume against its historical baseline and short-term highs, then plots directional markers on your chart.
This version adds MTF awareness, showing spikes from 1-minute, 5-minute, and 10-minute frames on a single chart. It’s ideal for traders monitoring microstructure shifts across multiple time compressions while staying on a fast chart (like 1-second or 1-minute).
Key Features
Dual Session Windows (DST-aware)
Automatically tracks Morning (05:30–08:30 MT) and Midday (11:00–13:30 MT) activity, adjusted for daylight savings.
Directional Spike Detection
Flags Buy spikes (green triangles) and Sell spikes (magenta triangles) using dynamic volume gates, Z-Score normalization, and recent-bar jump filters.
Multi-Timeframe Projection
Displays higher-timeframe (1m / 5m / 10m) spikes directly on your active chart for continuous visual context — even on sub-minute intervals.
Adaptive Volume Logic
Each spike is validated against:
Volume ≥ SMA × multiplier
Volume ≥ recent-high × jump factor
Optional Z-Score threshold for statistical significance
Session-Only Filtering
Ensures spikes are only plotted within specified trading sessions — ideal for futures or intraday equity traders.
Configurable Alerts
Built-in alert conditions for:
Any timeframe (MTF aggregate)
Individual 1m, 5m, or 10m windows
Alerts trigger only when a new qualifying spike appears at the close of its bar.
Use Cases
Detect algorithmic or institutional activity bursts inside your trading window.
Track confluence of volume surges across multiple timeframes.
Combine with FVGs, bank levels, or range breakouts to identify probable continuation or reversal zones.
Build custom automation or alert workflows around statistically unusual participation spikes.
Recommended Settings
Use on 1-minute chart for full MTF display.
Adjust the SMA length (default 20) and Z-Score threshold (default 3.0) to suit market volatility.
For scalping or high-frequency environments, disable the 10m layer to reduce visual clutter.
Credits
Developed by Jason Hyde
© 2025 — All rights reserved.
Designed for clarity, precision, and MTF-synchronized institutional volume detection.
오픈 소스 스크립트
트레이딩뷰의 진정한 정신에 따라, 이 스크립트의 작성자는 이를 오픈소스로 공개하여 트레이더들이 기능을 검토하고 검증할 수 있도록 했습니다. 작성자에게 찬사를 보냅니다! 이 코드는 무료로 사용할 수 있지만, 코드를 재게시하는 경우 하우스 룰이 적용된다는 점을 기억하세요.
면책사항
해당 정보와 게시물은 금융, 투자, 트레이딩 또는 기타 유형의 조언이나 권장 사항으로 간주되지 않으며, 트레이딩뷰에서 제공하거나 보증하는 것이 아닙니다. 자세한 내용은 이용 약관을 참조하세요.
오픈 소스 스크립트
트레이딩뷰의 진정한 정신에 따라, 이 스크립트의 작성자는 이를 오픈소스로 공개하여 트레이더들이 기능을 검토하고 검증할 수 있도록 했습니다. 작성자에게 찬사를 보냅니다! 이 코드는 무료로 사용할 수 있지만, 코드를 재게시하는 경우 하우스 룰이 적용된다는 점을 기억하세요.
면책사항
해당 정보와 게시물은 금융, 투자, 트레이딩 또는 기타 유형의 조언이나 권장 사항으로 간주되지 않으며, 트레이딩뷰에서 제공하거나 보증하는 것이 아닙니다. 자세한 내용은 이용 약관을 참조하세요.