OPEN-SOURCE SCRIPT
Williams Percent Range with Threshold
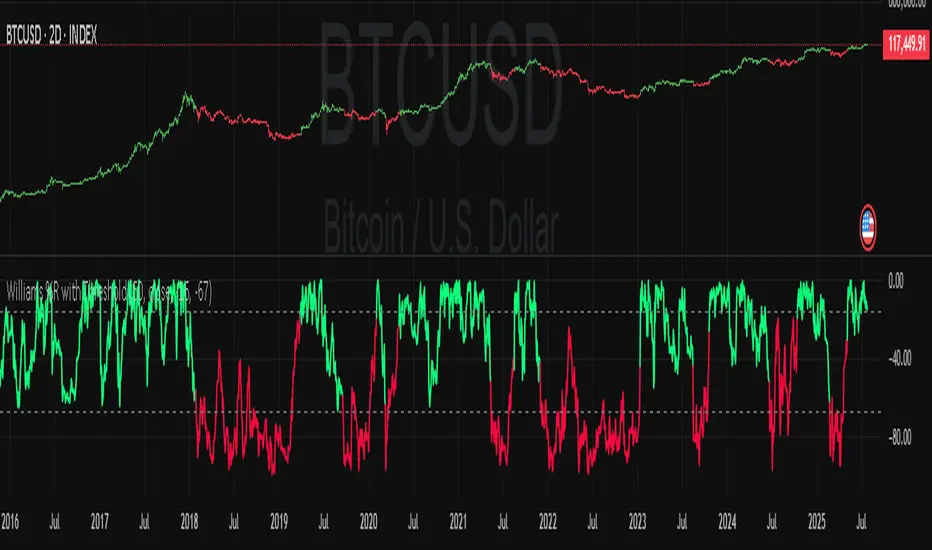
Enhance your trading analysis with the "Williams Percent Range with Threshold" indicator, a powerful modification of the classic Williams %R oscillator. This custom version introduces customizable uptrend and downtrend thresholds, combined with dynamic candlestick coloring to visually highlight market trends. Originally designed to identify overbought and oversold conditions, this script takes it a step further by allowing traders to define specific threshold levels for trend detection, making it a versatile tool for momentum and trend-following strategies.
Key Features:
Customizable Thresholds: Set your own uptrend (default: -16) and downtrend (default: -67) thresholds to adapt the indicator to your trading style.
Dynamic Candlestick Coloring: Candles turn green during uptrends, red during downtrends, and gray in neutral conditions, providing an intuitive visual cue directly on the price chart.
Flexible Length: Adjust the lookback period (default: 50) to fine-tune sensitivity.
Overlay Design: Integrates seamlessly with your price chart, enhancing readability without clutter.
How It Works:
The Williams %R calculates the current closing price's position relative to the highest and lowest prices over a specified period, expressed as a percentage between -100 and 0. This version adds trend detection based on user-defined thresholds, with candlestick colors reflecting the trend state. The indicator plots the %R line with color changes (green for uptrend, red for downtrend) and includes dashed lines for the custom thresholds.
Usage Tips:
Use the uptrend threshold (-16 by default) to identify potential buying opportunities when %R exceeds this level.
Apply the downtrend threshold (-67 by default) to spot selling opportunities when %R falls below.
Combine with other indicators (e.g., moving averages or support/resistance levels) for confirmation signals.
Adjust the length and thresholds based on the asset's volatility and your trading timeframe.
오픈 소스 스크립트
트레이딩뷰의 진정한 정신에 따라, 이 스크립트의 작성자는 이를 오픈소스로 공개하여 트레이더들이 기능을 검토하고 검증할 수 있도록 했습니다. 작성자에게 찬사를 보냅니다! 이 코드는 무료로 사용할 수 있지만, 코드를 재게시하는 경우 하우스 룰이 적용된다는 점을 기억하세요.
면책사항
해당 정보와 게시물은 금융, 투자, 트레이딩 또는 기타 유형의 조언이나 권장 사항으로 간주되지 않으며, 트레이딩뷰에서 제공하거나 보증하는 것이 아닙니다. 자세한 내용은 이용 약관을 참조하세요.
오픈 소스 스크립트
트레이딩뷰의 진정한 정신에 따라, 이 스크립트의 작성자는 이를 오픈소스로 공개하여 트레이더들이 기능을 검토하고 검증할 수 있도록 했습니다. 작성자에게 찬사를 보냅니다! 이 코드는 무료로 사용할 수 있지만, 코드를 재게시하는 경우 하우스 룰이 적용된다는 점을 기억하세요.
면책사항
해당 정보와 게시물은 금융, 투자, 트레이딩 또는 기타 유형의 조언이나 권장 사항으로 간주되지 않으며, 트레이딩뷰에서 제공하거나 보증하는 것이 아닙니다. 자세한 내용은 이용 약관을 참조하세요.