PROTECTED SOURCE SCRIPT
Global Market Signals: EMA ROC
Welcome!
Thanks for checking out my indicator.
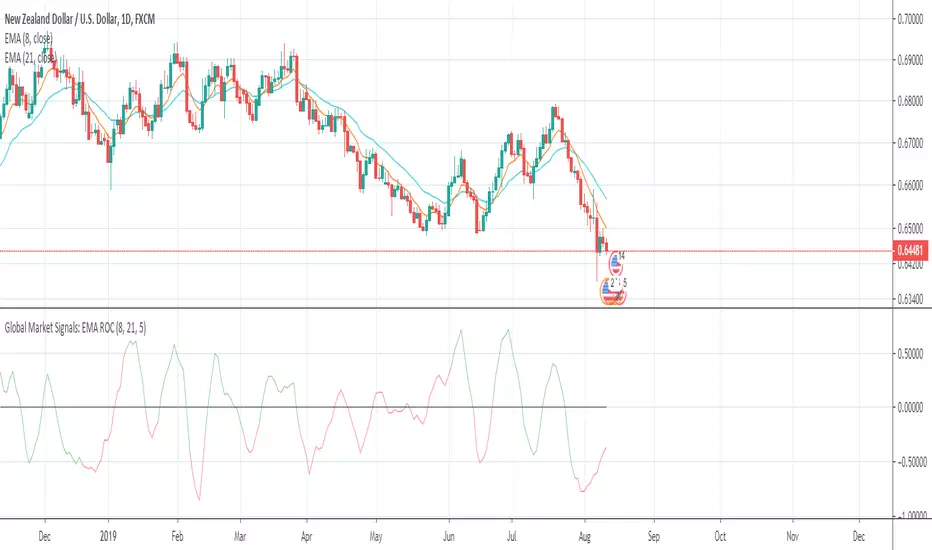
This is the difference in the rate of change between two exponential moving averages.
The colors are green and red:
- Green is when the fast EMA > slow EMA
- Red is when the fast EMA < slow EMA
When the indicator approaches it's upper or lower limits, it will indicate either sideways price movement or a reversal. When the color changes around it's upper or lower limits from green to red or vice-versa, an EMA crossover just occurred and a continuation of trend is possible before a pause or reversal in price.
I hope this helps!
Andre
Global Market Signals
Thanks for checking out my indicator.
This is the difference in the rate of change between two exponential moving averages.
The colors are green and red:
- Green is when the fast EMA > slow EMA
- Red is when the fast EMA < slow EMA
When the indicator approaches it's upper or lower limits, it will indicate either sideways price movement or a reversal. When the color changes around it's upper or lower limits from green to red or vice-versa, an EMA crossover just occurred and a continuation of trend is possible before a pause or reversal in price.
I hope this helps!
Andre
Global Market Signals
보호된 스크립트입니다
이 스크립트는 비공개 소스로 게시됩니다. 하지만 이를 자유롭게 제한 없이 사용할 수 있습니다 – 자세한 내용은 여기에서 확인하세요.
면책사항
해당 정보와 게시물은 금융, 투자, 트레이딩 또는 기타 유형의 조언이나 권장 사항으로 간주되지 않으며, 트레이딩뷰에서 제공하거나 보증하는 것이 아닙니다. 자세한 내용은 이용 약관을 참조하세요.
보호된 스크립트입니다
이 스크립트는 비공개 소스로 게시됩니다. 하지만 이를 자유롭게 제한 없이 사용할 수 있습니다 – 자세한 내용은 여기에서 확인하세요.
면책사항
해당 정보와 게시물은 금융, 투자, 트레이딩 또는 기타 유형의 조언이나 권장 사항으로 간주되지 않으며, 트레이딩뷰에서 제공하거나 보증하는 것이 아닙니다. 자세한 내용은 이용 약관을 참조하세요.