OPEN-SOURCE SCRIPT
Inverse Moving Average Weighted (IWMA)
Description:
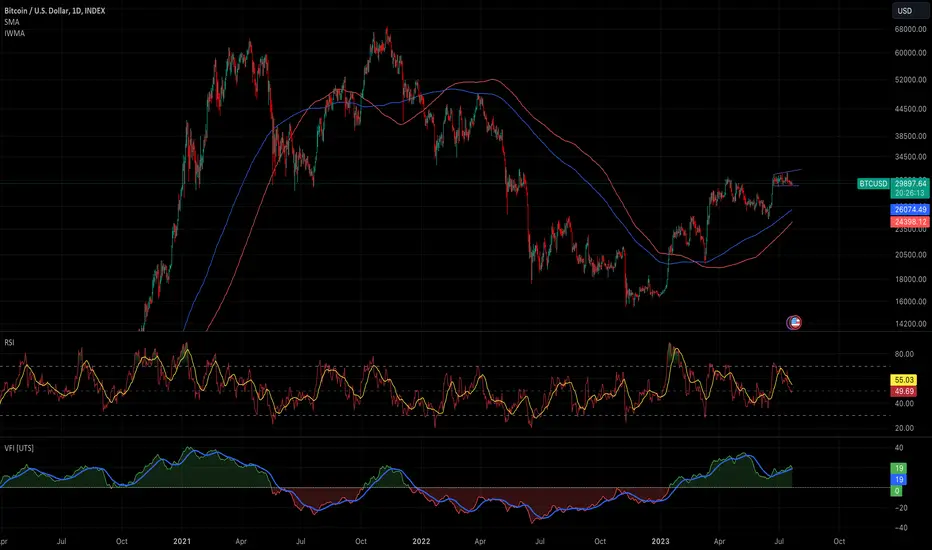
The Inverse Weighted Moving Average (IWMA) is a unique technical indicator that puts more emphasis on older price data compared to recent data. Unlike traditional moving averages that give more weight to recent data, the IWMA believes that older data points have a larger psychological impact on traders and therefore should be given more importance.
The IWMA is calculated by assigning weights to the price data points in a moving window, with the oldest data point given the highest weight and the most recent data point given the lowest weight. These weights are then used to calculate a weighted average, which forms the IWMA.
The IWMA can be used in the same way as other moving averages. When the price crosses above the IWMA, it may indicate a potential upward trend, signaling a good time to buy. Conversely, when the price crosses below the IWMA, it may indicate a potential downward trend, signaling a good time to sell.
The IWMA is a unique tool for traders who believe in the lasting impact of older price data. It provides a different perspective on price trends and can be a valuable addition to your trading toolkit.
오픈 소스 스크립트
트레이딩뷰의 진정한 정신에 따라, 이 스크립트의 작성자는 이를 오픈소스로 공개하여 트레이더들이 기능을 검토하고 검증할 수 있도록 했습니다. 작성자에게 찬사를 보냅니다! 이 코드는 무료로 사용할 수 있지만, 코드를 재게시하는 경우 하우스 룰이 적용된다는 점을 기억하세요.
면책사항
해당 정보와 게시물은 금융, 투자, 트레이딩 또는 기타 유형의 조언이나 권장 사항으로 간주되지 않으며, 트레이딩뷰에서 제공하거나 보증하는 것이 아닙니다. 자세한 내용은 이용 약관을 참조하세요.
오픈 소스 스크립트
트레이딩뷰의 진정한 정신에 따라, 이 스크립트의 작성자는 이를 오픈소스로 공개하여 트레이더들이 기능을 검토하고 검증할 수 있도록 했습니다. 작성자에게 찬사를 보냅니다! 이 코드는 무료로 사용할 수 있지만, 코드를 재게시하는 경우 하우스 룰이 적용된다는 점을 기억하세요.
면책사항
해당 정보와 게시물은 금융, 투자, 트레이딩 또는 기타 유형의 조언이나 권장 사항으로 간주되지 않으며, 트레이딩뷰에서 제공하거나 보증하는 것이 아닙니다. 자세한 내용은 이용 약관을 참조하세요.