INVITE-ONLY SCRIPT
업데이트됨 Waves Timeframe
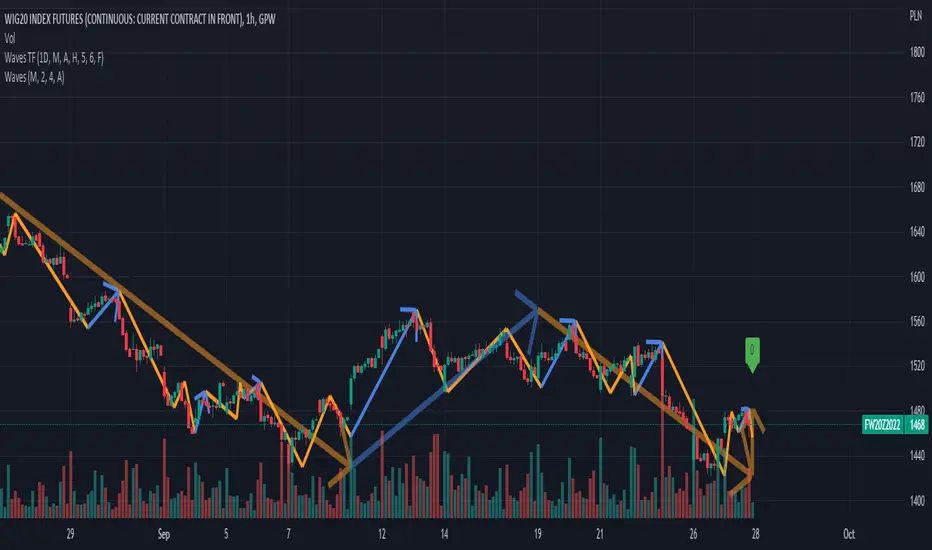
Custom timeframe trend wisualization tool in Wave theory. In script setting you can specify based on which timeframe (1D by default) data visaulizaction will be made. It's usefull in short time/day traiding where on the small interval you would like to see more global/bigger interval situation. If it's you case, please check "Waves Pro Trends", that gives posibility to easie check up to 3 different intervals.
Script settings:
• Timeframe – The interval based on which waves are calculated. Script is working correct only for intervals that are equal or more precise than picked here value. In case of picking lower interval than current, error message will appear.
• Type – Type of waves that are drawn:
o H(ide) – Not drawing any waves
o L(ow) – Drawing low level waves
o M(edium) – Drawing mid level waves
o B(oth) – Drawing both low and mid level waves
• Alfred – Showing extra informations about waves in the context of current candle.
• Wave – How script should visualize wave:
o H(ide) - Not drawing waves.
o S(olid line) – Drawng as solid line
o A (Solid line with Arrow) – Drawing as solid line with arrow
o D(otted line) – Drawing as dotted line.
• Shadow – How script should visualise wave shadows. Waves shadow it's a drawing mode in which wave is draw based on it's extrems instead of moment od detection.
o H(ide) - Do not draw any shadows
o S(olid line) – Draw with a solid line
o A (Solid line with Arrow) – Draw as solid line with arrorw
o D(otted line) – Draw as dotted line
• Low line – Color and line width for low level waves
• Medium line – Color and line width for mid level waves
• Impuls – Color and picking impuls mode:
o H(idden) – Do not show impuls
o F(irst) – Impuls is draw starting from the first wave up
o S(econd) – Impuls jis draw starting from the second wave up
o Auto – The algorithm performs an automatic analysis and selects which of the impulse drawing methods presents impulses with greater price dynamics.
릴리즈 노트
Package of improvements:- Fix problem with unconsistent real time data.
- Update trend visualization settings.
초대 전용 스크립트
이 스크립트는 작성자가 승인한 사용자만 접근할 수 있습니다. 사용하려면 요청 후 승인을 받아야 하며, 일반적으로 결제 후에 허가가 부여됩니다. 자세한 내용은 아래 작성자의 안내를 따르거나 Investor_R에게 직접 문의하세요.
트레이딩뷰는 스크립트의 작동 방식을 충분히 이해하고 작성자를 완전히 신뢰하지 않는 이상, 해당 스크립트에 비용을 지불하거나 사용하는 것을 권장하지 않습니다. 커뮤니티 스크립트에서 무료 오픈소스 대안을 찾아보실 수도 있습니다.
작성자 지시 사항
Latest instructions always on Youtube and blog page.
Write to toolkit4trading@gmail.com to get access.
To get access or report problem write on toolkit4trading@proton.me
More details on Website and Youtube.
More details on Website and Youtube.
면책사항
해당 정보와 게시물은 금융, 투자, 트레이딩 또는 기타 유형의 조언이나 권장 사항으로 간주되지 않으며, 트레이딩뷰에서 제공하거나 보증하는 것이 아닙니다. 자세한 내용은 이용 약관을 참조하세요.