OPEN-SOURCE SCRIPT
Duong_Sideway Zone
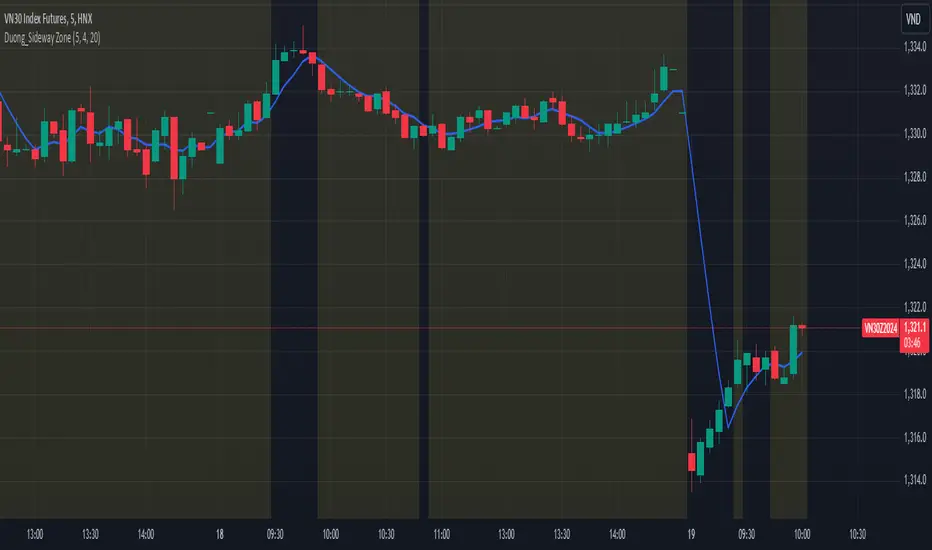
This indicator is designed to identify sideway (ranging) zones on the price chart. It uses a Moving Average (MA) and criteria such as the number of price crosses over the MA, as well as breakout checks, to determine whether the market is in a sideway state. When a sideway zone is detected, it is highlighted with a yellow background on the chart.
Key Features:
MA Line: Uses a Moving Average (MA) as the basis for trend identification.
Sideway Threshold: Based on the number of price crosses over the MA within a specific period.
Breakout Check: Excludes zones from being considered sideway if a breakout occurs beyond the ATR threshold.
Visual Highlighting: Highlights sideway zones with a yellow background for easy identification.
This indicator is ideal for traders looking to identify ranging market phases to adjust their trading strategies accordingly.
For example, if within the last 20 candles, the number of times the closing price crosses the MA5 is greater than 4, it is considered a sideway zone, except in cases where the closing price of a recent candle has broken out of the highest/ lowest price of the previous 20 candles.
오픈 소스 스크립트
트레이딩뷰의 진정한 정신에 따라, 이 스크립트의 작성자는 이를 오픈소스로 공개하여 트레이더들이 기능을 검토하고 검증할 수 있도록 했습니다. 작성자에게 찬사를 보냅니다! 이 코드는 무료로 사용할 수 있지만, 코드를 재게시하는 경우 하우스 룰이 적용된다는 점을 기억하세요.
면책사항
해당 정보와 게시물은 금융, 투자, 트레이딩 또는 기타 유형의 조언이나 권장 사항으로 간주되지 않으며, 트레이딩뷰에서 제공하거나 보증하는 것이 아닙니다. 자세한 내용은 이용 약관을 참조하세요.
오픈 소스 스크립트
트레이딩뷰의 진정한 정신에 따라, 이 스크립트의 작성자는 이를 오픈소스로 공개하여 트레이더들이 기능을 검토하고 검증할 수 있도록 했습니다. 작성자에게 찬사를 보냅니다! 이 코드는 무료로 사용할 수 있지만, 코드를 재게시하는 경우 하우스 룰이 적용된다는 점을 기억하세요.
면책사항
해당 정보와 게시물은 금융, 투자, 트레이딩 또는 기타 유형의 조언이나 권장 사항으로 간주되지 않으며, 트레이딩뷰에서 제공하거나 보증하는 것이 아닙니다. 자세한 내용은 이용 약관을 참조하세요.