OPEN-SOURCE SCRIPT
업데이트됨 Customisable Stoch RSI [10 PRESETS INCLUDED]
Customisable Stochastic by Nicholas Kormanik
A stochastic oscillator is a momentum indicator comparing a particular closing price of a security to a range of its prices over a certain period of time.
The sensitivity of the oscillator to market movements is reducible by adjusting that time period or by taking a moving average of the result.
It is used to generate overbought and oversold trading signals, utilizing a 0–100 bounded range of values.
In this version we have 4 levels
top levels are
95 - extra overbought
80 - semi-extra overbought
70 - standart overbought
bottom levels are
5 - extra oversold
20 - semi-extra oversold
30 - standart oversold
Message by Nicholas Kormanik:
"The formula I've adopted was put on the Silicon Investor web site thread by
'bdog'. Basically, I just leave the Slowing Periods (mp3) to 1, so it
really plays no part in things. However, if somebody presents a good
argument for using other than 1 ... hey, I'm amenable.
Chande, the original inventor, didn't use a moving average on the whole
thing. Chande's result was therefore sort of choppy. I guess along the way
people decided to add the EMA Periods to smooth things out."
There are 10 presets, try to find your best!
[Presets]
1. 5 -- 5 -- 3
2. 8 -- 8 -- 5
3. 13 -- 13 -- 13
4. 21 -- 15 -- 13
5. 21 -- 21 -- 13
6. 34 -- 34 -- 13
7. 55 -- 55 -- 21
8. 89 -- 13 -- 34
9. 89 -- 89 -- 21
10. 233 -- 233 -- 34
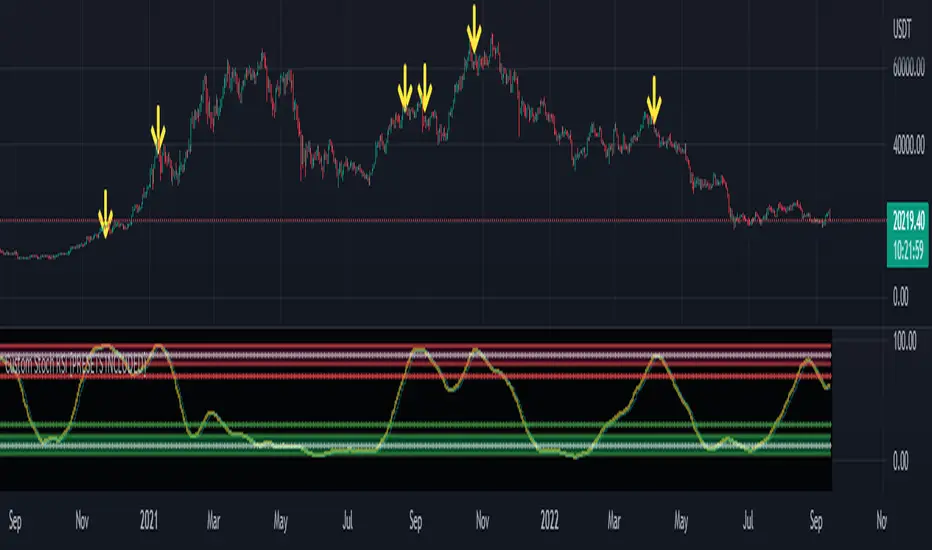
On the chart im using 9th preset and the timeframe is daily on BTCUSD pair.
*DISCLAIMER*
Use this indicator for educational purpose only, i don't recommend you to use it to trade for real money!
A stochastic oscillator is a momentum indicator comparing a particular closing price of a security to a range of its prices over a certain period of time.
The sensitivity of the oscillator to market movements is reducible by adjusting that time period or by taking a moving average of the result.
It is used to generate overbought and oversold trading signals, utilizing a 0–100 bounded range of values.
In this version we have 4 levels
top levels are
95 - extra overbought
80 - semi-extra overbought
70 - standart overbought
bottom levels are
5 - extra oversold
20 - semi-extra oversold
30 - standart oversold
Message by Nicholas Kormanik:
"The formula I've adopted was put on the Silicon Investor web site thread by
'bdog'. Basically, I just leave the Slowing Periods (mp3) to 1, so it
really plays no part in things. However, if somebody presents a good
argument for using other than 1 ... hey, I'm amenable.
Chande, the original inventor, didn't use a moving average on the whole
thing. Chande's result was therefore sort of choppy. I guess along the way
people decided to add the EMA Periods to smooth things out."
There are 10 presets, try to find your best!
[Presets]
1. 5 -- 5 -- 3
2. 8 -- 8 -- 5
3. 13 -- 13 -- 13
4. 21 -- 15 -- 13
5. 21 -- 21 -- 13
6. 34 -- 34 -- 13
7. 55 -- 55 -- 21
8. 89 -- 13 -- 34
9. 89 -- 89 -- 21
10. 233 -- 233 -- 34
On the chart im using 9th preset and the timeframe is daily on BTCUSD pair.
*DISCLAIMER*
Use this indicator for educational purpose only, i don't recommend you to use it to trade for real money!
릴리즈 노트
Visual updates오픈 소스 스크립트
트레이딩뷰의 진정한 정신에 따라, 이 스크립트의 작성자는 이를 오픈소스로 공개하여 트레이더들이 기능을 검토하고 검증할 수 있도록 했습니다. 작성자에게 찬사를 보냅니다! 이 코드는 무료로 사용할 수 있지만, 코드를 재게시하는 경우 하우스 룰이 적용된다는 점을 기억하세요.
면책사항
해당 정보와 게시물은 금융, 투자, 트레이딩 또는 기타 유형의 조언이나 권장 사항으로 간주되지 않으며, 트레이딩뷰에서 제공하거나 보증하는 것이 아닙니다. 자세한 내용은 이용 약관을 참조하세요.
오픈 소스 스크립트
트레이딩뷰의 진정한 정신에 따라, 이 스크립트의 작성자는 이를 오픈소스로 공개하여 트레이더들이 기능을 검토하고 검증할 수 있도록 했습니다. 작성자에게 찬사를 보냅니다! 이 코드는 무료로 사용할 수 있지만, 코드를 재게시하는 경우 하우스 룰이 적용된다는 점을 기억하세요.
면책사항
해당 정보와 게시물은 금융, 투자, 트레이딩 또는 기타 유형의 조언이나 권장 사항으로 간주되지 않으며, 트레이딩뷰에서 제공하거나 보증하는 것이 아닙니다. 자세한 내용은 이용 약관을 참조하세요.