OPEN-SOURCE SCRIPT
Streak-Based Trading Strategy
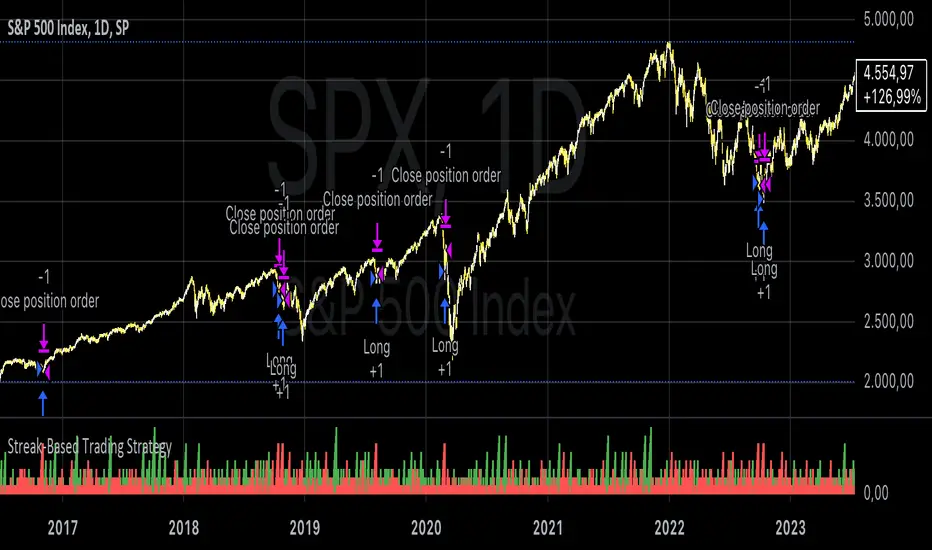
The strategy outlined in the provided script is a streak-based trading strategy that focuses on analyzing winning and losing streaks. It’s important to emphasize that this strategy is not intended for actual trading but rather for statistical analysis of streak series.
How the Strategy Works
1. Parameter Definition:
• Trade Direction: Users can choose between “Long” (buy) and “Short” (sell).
• Streak Threshold: Defines how many consecutive wins or losses are needed to trigger a trade.
• Hold Duration: Specifies how many periods the position will be held.
• Doji Threshold: Determines the sensitivity for Doji candles, which indicate market uncertainty.
2. Streak Calculation:
• The script identifies Doji candles and counts winning and losing streaks based on the closing price compared to the previous closing price.
• Streak counting occurs only when no position is currently held.
3. Trade Conditions:
• If the loss streak reaches the defined threshold and the trade direction is “Long,” a buy position is opened.
• If the win streak is met and the trade direction is “Short,” a sell position is opened.
• The position is held for the specified duration.
4. Visualization:
• Winning and losing streaks are plotted as histograms to facilitate analysis.
Scientific Basis
The concept of analyzing streaks in financial markets is well-documented in behavioral economics and finance. Studies have shown that markets often exhibit momentum and trend-following behavior, meaning the likelihood of consecutive winning or losing periods can be higher than what random statistics would suggest (see, for example, “The Behavior of Stock-Market Prices” by Eugene Fama).
Additionally, empirical research indicates that investors often make decisions based on psychological factors influenced by streaks. This can lead to irrational behavior, as they may focus on past wins or losses (see “Behavioral Finance: Psychology, Decision-Making, and Markets” by R. M. F. F. Thaler).
Overall, this strategy serves as a tool for statistical analysis of streak series, providing deeper insights into market behavior and trends rather than being directly used for trading decisions.
오픈 소스 스크립트
트레이딩뷰의 진정한 정신에 따라, 이 스크립트의 작성자는 이를 오픈소스로 공개하여 트레이더들이 기능을 검토하고 검증할 수 있도록 했습니다. 작성자에게 찬사를 보냅니다! 이 코드는 무료로 사용할 수 있지만, 코드를 재게시하는 경우 하우스 룰이 적용된다는 점을 기억하세요.
Where others speculate, we systematize.
edgetools.org
edgetools.org
면책사항
해당 정보와 게시물은 금융, 투자, 트레이딩 또는 기타 유형의 조언이나 권장 사항으로 간주되지 않으며, 트레이딩뷰에서 제공하거나 보증하는 것이 아닙니다. 자세한 내용은 이용 약관을 참조하세요.