OPEN-SOURCE SCRIPT
双布林Dual Bollinger Bands
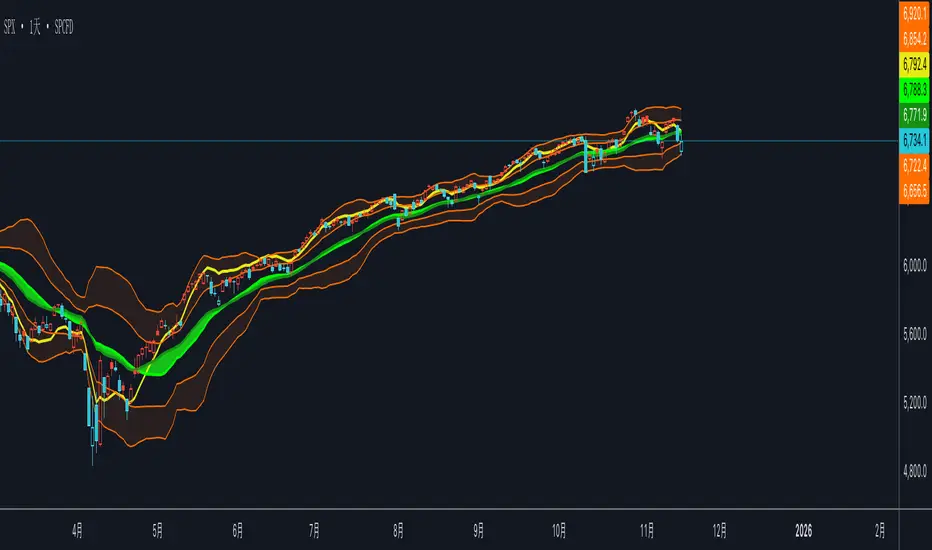
This technical indicator combines dual Bollinger Bands with multiple moving average overlays to provide a comprehensive view of price trends, volatility, and potential support/resistance zones.
**Components:**
1. **TEMA21 (Triple Exponential Moving Average)**
- Yellow line representing the 21-period TEMA
- Provides smooth trend direction with reduced lag compared to traditional moving averages
- Calculated using three sequential EMAs to filter out market noise
2. **SMA21 & EMA21 Channel**
- Green filled area between the 21-period Simple Moving Average and Exponential Moving Average
- Visualizes the dynamic zone where these two averages interact
- Helps identify trend strength when price stays above/below this channel
3. **MA21 (Simple Moving Average)**
- Bright green line showing the 21-period SMA
- Classic trend-following indicator
4. **EMA21 (Exponential Moving Average)**
- Dark green line displaying the 21-period EMA
- More responsive to recent price changes than SMA
5. **Dual Bollinger Bands**
- **Outer Bands (2 Standard Deviations)**: Orange lines marking the traditional Bollinger Band boundaries
- **Inner Bands (1 Standard Deviation)**: Orange lines creating a tighter volatility zone
- **Orange Shaded Areas**: Highlight the zones between outer and inner bands
- All bands use a 21-period basis and are fully customizable
**Settings:**
- Length: 21 (adjustable)
- Source: Close price (adjustable)
- Outer Band StdDev: 2.0 (adjustable)
- Inner Band StdDev: 1.0 (adjustable)
- Offset: 0 (adjustable from -500 to +500)
**Usage:**
This indicator is ideal for identifying trend direction, volatility expansion/contraction, and potential reversal zones. The dual Bollinger Bands provide multiple levels for support/resistance analysis, while the moving averages confirm trend strength and direction.
오픈 소스 스크립트
트레이딩뷰의 진정한 정신에 따라, 이 스크립트의 작성자는 이를 오픈소스로 공개하여 트레이더들이 기능을 검토하고 검증할 수 있도록 했습니다. 작성자에게 찬사를 보냅니다! 이 코드는 무료로 사용할 수 있지만, 코드를 재게시하는 경우 하우스 룰이 적용된다는 점을 기억하세요.
면책사항
해당 정보와 게시물은 금융, 투자, 트레이딩 또는 기타 유형의 조언이나 권장 사항으로 간주되지 않으며, 트레이딩뷰에서 제공하거나 보증하는 것이 아닙니다. 자세한 내용은 이용 약관을 참조하세요.
오픈 소스 스크립트
트레이딩뷰의 진정한 정신에 따라, 이 스크립트의 작성자는 이를 오픈소스로 공개하여 트레이더들이 기능을 검토하고 검증할 수 있도록 했습니다. 작성자에게 찬사를 보냅니다! 이 코드는 무료로 사용할 수 있지만, 코드를 재게시하는 경우 하우스 룰이 적용된다는 점을 기억하세요.
면책사항
해당 정보와 게시물은 금융, 투자, 트레이딩 또는 기타 유형의 조언이나 권장 사항으로 간주되지 않으며, 트레이딩뷰에서 제공하거나 보증하는 것이 아닙니다. 자세한 내용은 이용 약관을 참조하세요.