OPEN-SOURCE SCRIPT
Currency Pair Index Indicator
Here's how it works step by step:
The indicator takes an input parameter called "length," which determines the number of bars to consider for the calculation. A higher length value will result in a smoother indicator, while a lower length value will make it more sensitive to recent price changes.
It then calculates the bullish sentiment by summing the volume multiplied by the price change (close - open) for each bar where the close price is greater than the open price. If the close price is not greater than the open price, the value for that bar is set to zero. The sum of these values is divided by the total volume for the selected bars.
Similarly, the bearish sentiment is calculated by summing the volume multiplied by the price change (open - close) for each bar where the close price is less than the open price. If the close price is not less than the open price, the value for that bar is set to zero. The sum of these values is divided by the total volume for the selected bars.
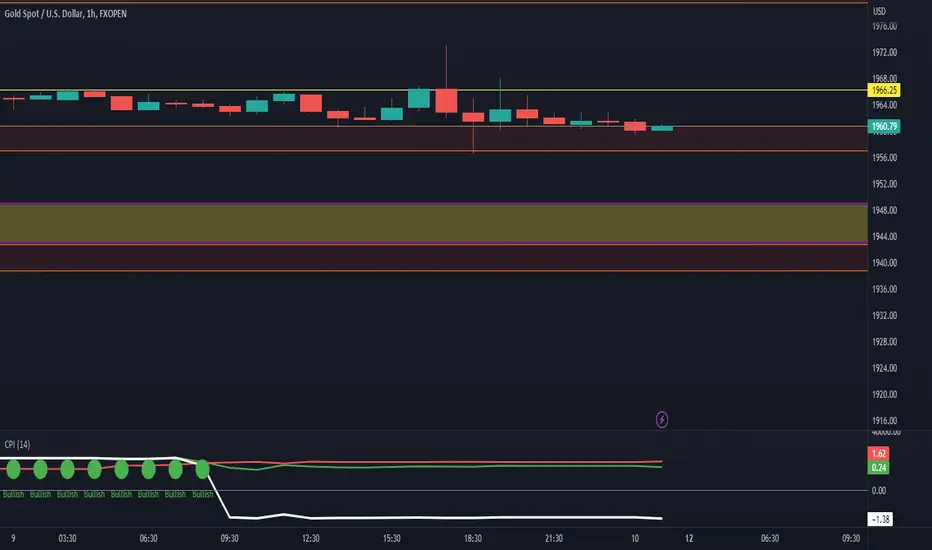
The bullish and bearish values are then plotted on the chart as separate line graphs. The bullish sentiment is represented by a green line, while the bearish sentiment is represented by a red line.
The difference between the bullish and bearish values is also plotted as a blue line. This line represents the overall sentiment of the currency pair index.
Additionally, arrow symbols are plotted below the price bars to indicate bullish or bearish signals. A green arrow is displayed when the bullish sentiment is higher than the bearish sentiment, indicating a bullish signal. A red arrow is displayed when the bearish sentiment is higher than the bullish sentiment, indicating a bearish signal.
By observing the indicator's line graphs and arrow symbols, traders can get an idea of the overall sentiment of the currency pair and identify potential bullish or bearish trading opportunities.
The indicator takes an input parameter called "length," which determines the number of bars to consider for the calculation. A higher length value will result in a smoother indicator, while a lower length value will make it more sensitive to recent price changes.
It then calculates the bullish sentiment by summing the volume multiplied by the price change (close - open) for each bar where the close price is greater than the open price. If the close price is not greater than the open price, the value for that bar is set to zero. The sum of these values is divided by the total volume for the selected bars.
Similarly, the bearish sentiment is calculated by summing the volume multiplied by the price change (open - close) for each bar where the close price is less than the open price. If the close price is not less than the open price, the value for that bar is set to zero. The sum of these values is divided by the total volume for the selected bars.
The bullish and bearish values are then plotted on the chart as separate line graphs. The bullish sentiment is represented by a green line, while the bearish sentiment is represented by a red line.
The difference between the bullish and bearish values is also plotted as a blue line. This line represents the overall sentiment of the currency pair index.
Additionally, arrow symbols are plotted below the price bars to indicate bullish or bearish signals. A green arrow is displayed when the bullish sentiment is higher than the bearish sentiment, indicating a bullish signal. A red arrow is displayed when the bearish sentiment is higher than the bullish sentiment, indicating a bearish signal.
By observing the indicator's line graphs and arrow symbols, traders can get an idea of the overall sentiment of the currency pair and identify potential bullish or bearish trading opportunities.
오픈 소스 스크립트
트레이딩뷰의 진정한 정신에 따라, 이 스크립트의 작성자는 이를 오픈소스로 공개하여 트레이더들이 기능을 검토하고 검증할 수 있도록 했습니다. 작성자에게 찬사를 보냅니다! 이 코드는 무료로 사용할 수 있지만, 코드를 재게시하는 경우 하우스 룰이 적용된다는 점을 기억하세요.
면책사항
해당 정보와 게시물은 금융, 투자, 트레이딩 또는 기타 유형의 조언이나 권장 사항으로 간주되지 않으며, 트레이딩뷰에서 제공하거나 보증하는 것이 아닙니다. 자세한 내용은 이용 약관을 참조하세요.
오픈 소스 스크립트
트레이딩뷰의 진정한 정신에 따라, 이 스크립트의 작성자는 이를 오픈소스로 공개하여 트레이더들이 기능을 검토하고 검증할 수 있도록 했습니다. 작성자에게 찬사를 보냅니다! 이 코드는 무료로 사용할 수 있지만, 코드를 재게시하는 경우 하우스 룰이 적용된다는 점을 기억하세요.
면책사항
해당 정보와 게시물은 금융, 투자, 트레이딩 또는 기타 유형의 조언이나 권장 사항으로 간주되지 않으며, 트레이딩뷰에서 제공하거나 보증하는 것이 아닙니다. 자세한 내용은 이용 약관을 참조하세요.