INVITE-ONLY SCRIPT
업데이트됨 Q-Bar Signals
Hello Traders & Q Zoners
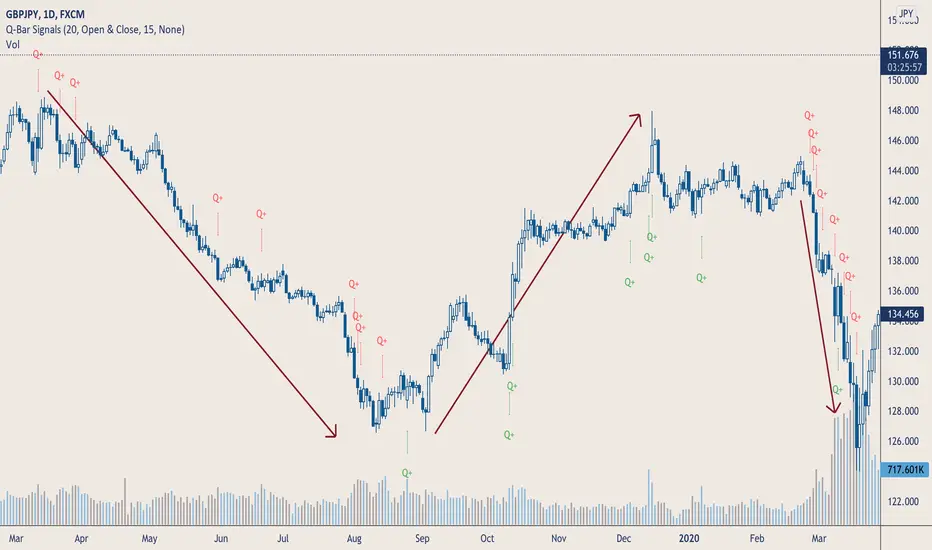
I introduce to you my latest indicator “Q-Bar Signals”. This indicator compares candlestick sizes as well as volume levels to check if latest candle is greater in both size and volume to a user-defined set of bars back.
Condition 1: For bullish candles, the indicator will measure the candlestick size of x number of bearish candles back and take the average size. It then takes the size of the bullish candle and if it is bigger than the average of x number of bearish candles, then it will display a green “Q” below that bullish candle. The opposite signal is true for bearish candles, displaying a red “Q” above the candlestick when the bearish candle is larger in size than the average number of bullish candles back.
Condition 2: The second part of this indicator compares volume. If a candlestick has met the first condition, it will also measure the volume of that candlestick and compare it to the volumes of a user-defined number of bars back. If the candlestick is bullish, it will look at the last x number of bearish volume bars and check if the bullish volume is higher than the highest volume of the bearish candles. If the condition is met, a green “Q+” will appear below the candle for bullish candles, and a red “Q+” will appear above the candle for bearish candles.
The user has a few different input options as well as alerts:
- Number of bars back to measure candlestick size from and take its average
- The candlestick measurement method: Between high to low, between open to close, or between the high/low to close (bullish candles measured between low to close, bearish candles measured between high to close)
- Number of bars back to check highest volume from and compare to current candlestick volume.
- Option to show only Q signals or both Q+ signals.
- Alerts for when signal first appears.
The signal waits for the candle to close and will then display signal and/or alert on the very opening of the next bar.
Tooltips have been added to the Q and Q+ labels which will display information containing the candlestick sizes and volume sizes to show you how the calculation is being performed and how big the differences are.
This indicator is meant to be used in conjunction with other tools and methods to help traders spot significant changes in price action and volume spikes.
Enjoy!
릴리즈 노트
Minor UpdateMore accuracy applied on measurement method
초대 전용 스크립트
이 스크립트는 작성자가 승인한 사용자만 접근할 수 있습니다. 사용하려면 요청 후 승인을 받아야 하며, 일반적으로 결제 후에 허가가 부여됩니다. 자세한 내용은 아래 작성자의 안내를 따르거나 The_Q_Zones에게 직접 문의하세요.
트레이딩뷰는 스크립트의 작동 방식을 충분히 이해하고 작성자를 완전히 신뢰하지 않는 이상, 해당 스크립트에 비용을 지불하거나 사용하는 것을 권장하지 않습니다. 커뮤니티 스크립트에서 무료 오픈소스 대안을 찾아보실 수도 있습니다.
작성자 지시 사항
For more inquiries on below e-mail
Info@theqzones.com
면책사항
해당 정보와 게시물은 금융, 투자, 트레이딩 또는 기타 유형의 조언이나 권장 사항으로 간주되지 않으며, 트레이딩뷰에서 제공하거나 보증하는 것이 아닙니다. 자세한 내용은 이용 약관을 참조하세요.