PROTECTED SOURCE SCRIPT
RSIofAggregateHighs

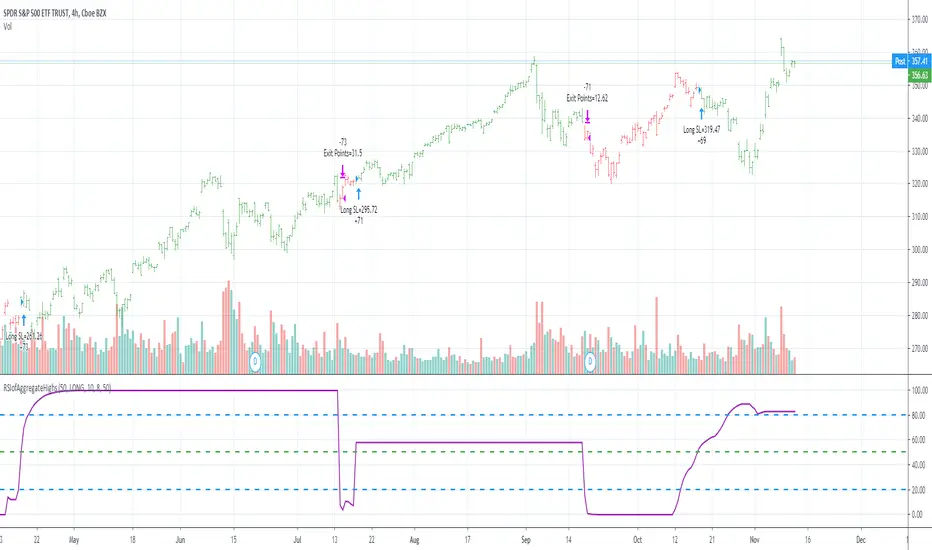
This strategy is based on aggregate of highs of specified length. Then this value is input to RSI 14 period.
Take long when the curve crossing up 23.6 , 32.8 , 50 , 61.8 and 72 ... These are Fib numbers ... ( you could use simple oversold level 20 or 30 , simple overbought level 70 or 80. )
Better results found when crossing up 50 line. Closing the LONG trade also use the same setting but when crossing down.
It best works for one hour / 4 hours chart.
Tested for SPY , QQQ and AAPL symbols.
Stop Loss set to 8%
I have also added SHORT parameter , however SHORT trade results are NOT good on any time frame.
Warning
for the use of educational purposes only
보호된 스크립트입니다
이 스크립트는 비공개 소스로 게시됩니다. 하지만 이를 자유롭게 제한 없이 사용할 수 있습니다 – 자세한 내용은 여기에서 확인하세요.
면책사항
해당 정보와 게시물은 금융, 투자, 트레이딩 또는 기타 유형의 조언이나 권장 사항으로 간주되지 않으며, 트레이딩뷰에서 제공하거나 보증하는 것이 아닙니다. 자세한 내용은 이용 약관을 참조하세요.
보호된 스크립트입니다
이 스크립트는 비공개 소스로 게시됩니다. 하지만 이를 자유롭게 제한 없이 사용할 수 있습니다 – 자세한 내용은 여기에서 확인하세요.
면책사항
해당 정보와 게시물은 금융, 투자, 트레이딩 또는 기타 유형의 조언이나 권장 사항으로 간주되지 않으며, 트레이딩뷰에서 제공하거나 보증하는 것이 아닙니다. 자세한 내용은 이용 약관을 참조하세요.