PROTECTED SOURCE SCRIPT
Ori Volume Profile
Ori Volume Profile plots trading volume as a histogram on the price scale.
You can add it more than once to increase its precision.
It starts drawing from the bar it starts to calculate.
If you can't see the volume profile zoom out and go left in the chart until you can see the starting position.
For adding it multiple times you should set inputs correclty. For example if you want to add it 3 times, total indicator amount should be 3 in all of the 3 indicator and you should enumerate their order of the current amount. First indicators order should be 1, second indicators order should be 2, third indicators order should be 3 etc
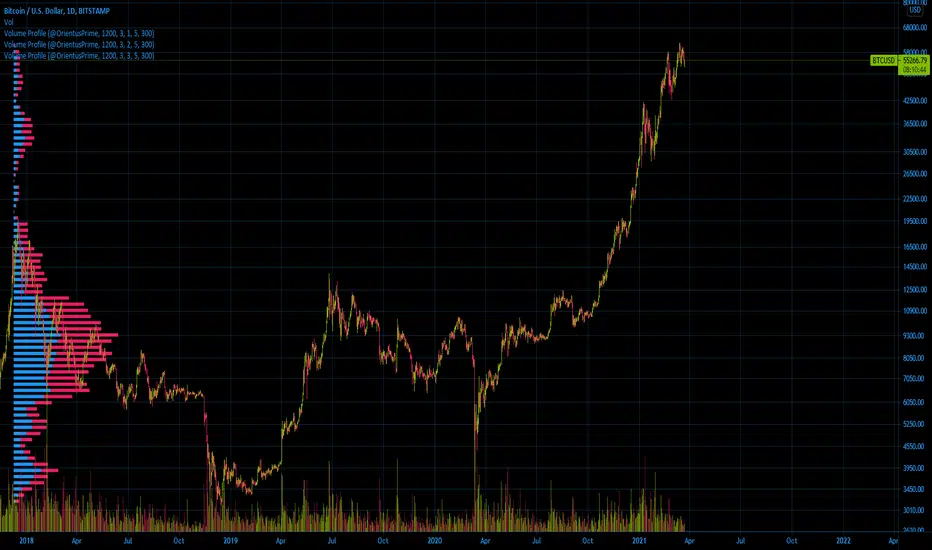
Settings for the one in the image:
Firs indicator: 1200 3 1 5 300
Second indicator:1200 3 2 5 300
Third indicator:1200 3 3 5 300
You can add it more than once to increase its precision.
It starts drawing from the bar it starts to calculate.
If you can't see the volume profile zoom out and go left in the chart until you can see the starting position.
For adding it multiple times you should set inputs correclty. For example if you want to add it 3 times, total indicator amount should be 3 in all of the 3 indicator and you should enumerate their order of the current amount. First indicators order should be 1, second indicators order should be 2, third indicators order should be 3 etc
Settings for the one in the image:
Firs indicator: 1200 3 1 5 300
Second indicator:1200 3 2 5 300
Third indicator:1200 3 3 5 300
보호된 스크립트입니다
이 스크립트는 비공개 소스로 게시됩니다. 하지만 이를 자유롭게 제한 없이 사용할 수 있습니다 – 자세한 내용은 여기에서 확인하세요.
면책사항
해당 정보와 게시물은 금융, 투자, 트레이딩 또는 기타 유형의 조언이나 권장 사항으로 간주되지 않으며, 트레이딩뷰에서 제공하거나 보증하는 것이 아닙니다. 자세한 내용은 이용 약관을 참조하세요.
보호된 스크립트입니다
이 스크립트는 비공개 소스로 게시됩니다. 하지만 이를 자유롭게 제한 없이 사용할 수 있습니다 – 자세한 내용은 여기에서 확인하세요.
면책사항
해당 정보와 게시물은 금융, 투자, 트레이딩 또는 기타 유형의 조언이나 권장 사항으로 간주되지 않으며, 트레이딩뷰에서 제공하거나 보증하는 것이 아닙니다. 자세한 내용은 이용 약관을 참조하세요.