PROTECTED SOURCE SCRIPT
ATR + Fibs
Description:
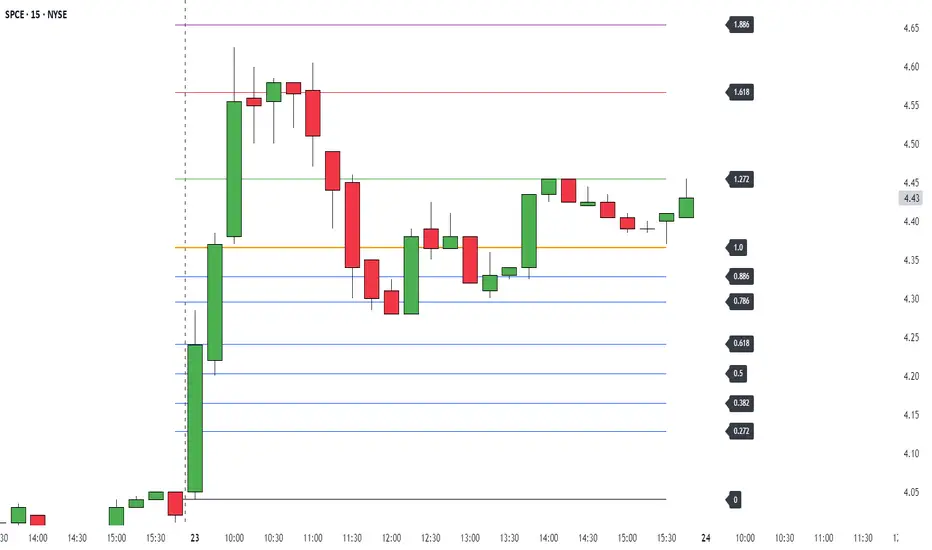
This script plots ATR levels and ATR-based Fibonacci extension levels from either the Low of Day, or High of Day, using the daily Average True Range (ATR) to project key price zones. It's designed to help traders quickly assess where price is trading relative to the day’s ATR.
Features:
Visual reference for how far price has moved relative to today's ATR
Projects fib levels using daily ATR from LOD or HOD
Optional display of fib lines, % labels, and price values
Customizable colors and line widths per level
Auto-resets daily with updated highs/lows
Works on all intraday and higher timeframes
Ideal for traders who want to gauge intraday extension, or frame entries using volatility-based levels.
보호된 스크립트입니다
이 스크립트는 비공개 소스로 게시됩니다. 하지만 이를 자유롭게 제한 없이 사용할 수 있습니다 – 자세한 내용은 여기에서 확인하세요.
면책사항
해당 정보와 게시물은 금융, 투자, 트레이딩 또는 기타 유형의 조언이나 권장 사항으로 간주되지 않으며, 트레이딩뷰에서 제공하거나 보증하는 것이 아닙니다. 자세한 내용은 이용 약관을 참조하세요.
보호된 스크립트입니다
이 스크립트는 비공개 소스로 게시됩니다. 하지만 이를 자유롭게 제한 없이 사용할 수 있습니다 – 자세한 내용은 여기에서 확인하세요.
면책사항
해당 정보와 게시물은 금융, 투자, 트레이딩 또는 기타 유형의 조언이나 권장 사항으로 간주되지 않으며, 트레이딩뷰에서 제공하거나 보증하는 것이 아닙니다. 자세한 내용은 이용 약관을 참조하세요.