OPEN-SOURCE SCRIPT
Standard Deviation of Returns: Divergence
Purpose:
The "Standard Deviation of Returns: Divergence" indicator is designed to help traders identify potential trend reversals or continuation signals by analyzing divergences between price action and the statistical volatility of returns. Divergences can signal weakening momentum in the prevailing trend, offering insight into potential buying or selling opportunities.
Key Components
1. Returns Calculation:
* The indicator uses logarithmic returns (log(close / close[1])) to measure relative price changes in a normalized manner.
* Log returns are more effective than simple price differences when analyzing data across varying price levels, as they account for percentage-based changes.
2. Standard Deviation of Returns:
* The script computes the standard deviation of returns over a user-defined lookback period (ta.stdev(returns, lookback)).
* Standard deviation measures the dispersion of returns around their average, effectively quantifying market volatility.
* A higher standard deviation indicates increased volatility, while lower standard deviation reflects a calmer market.
3. Price Action:
* Detects higher highs (new peaks in price) and lower lows (new troughs in price) over the lookback period.
* Price trends are compared to the behavior of the standard deviation.
4. Divergence Detection:
A divergence occurs when price action (higher highs or lower lows) is not confirmed by a corresponding movement in standard deviation:
Bullish Divergence: Price makes a lower low, but the standard deviation does not, signaling potential upward momentum.
Bearish Divergence: Price makes a higher high, but the standard deviation does not, signaling potential downward momentum.
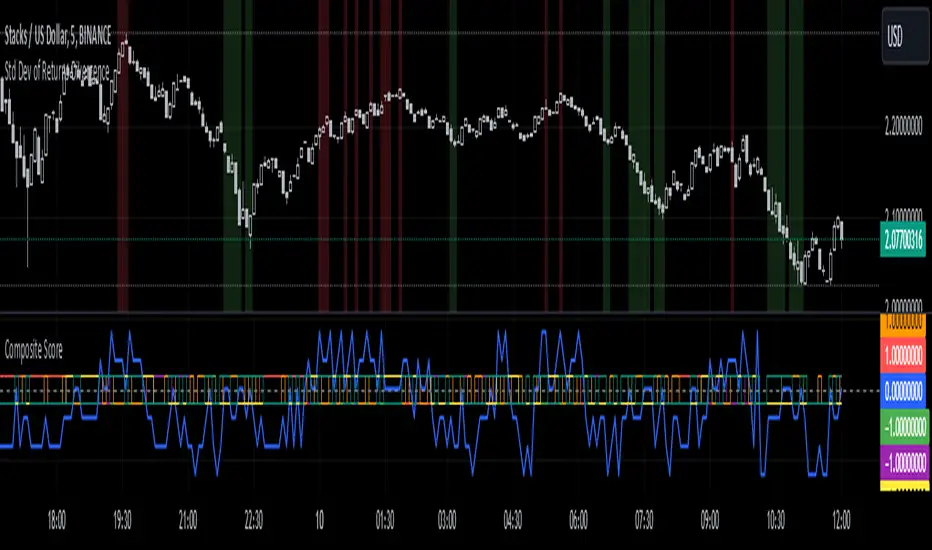
5. Visual Cues:
The script highlights divergence regions directly on the chart:
Green Background: Indicates a bullish divergence (potential buy signal).
Red Background: Indicates a bearish divergence (potential sell signal).
How It Works
Inputs:
* The user specifies the lookback period (lookback) for calculating the standard deviation and detecting divergences.
Calculation:
* Each bar’s returns are computed and used to calculate the standard deviation over the specified lookback period.
* The indicator evaluates price highs/lows and compares these with the highest and lowest values of the standard deviation within the same lookback period.
Highlight of Divergences:
When divergences are detected:
Bullish Divergence: The background of the chart is shaded green.
Bearish Divergence: The background of the chart is shaded red.
Trading Application
Bullish Divergence:
* Occurs when the market is oversold, or downward momentum is weakening.
* Suggests a potential reversal to an uptrend, signaling a buying opportunity.
Bearish Divergence:
* Occurs when the market is overbought, or upward momentum is weakening.
* Suggests a potential reversal to a downtrend, signaling a selling opportunity.
Contextual Use:
* Use this indicator in conjunction with other technical tools like RSI, MACD, or moving averages to confirm signals.
* Effective in volatile or ranging markets to help anticipate shifts in momentum.
Summary
The "Standard Deviation of Returns: Divergence" indicator is a robust tool for spotting divergences that can signal weakening market trends. It combines statistical volatility with price action analysis to highlight key areas of potential reversals. By integrating this tool into your trading strategy, you can gain additional confirmation for entries or exits while keeping a close watch on momentum shifts.
Disclaimer: This is not a financial advise; please consult your financial advisor for personalized advice.
The "Standard Deviation of Returns: Divergence" indicator is designed to help traders identify potential trend reversals or continuation signals by analyzing divergences between price action and the statistical volatility of returns. Divergences can signal weakening momentum in the prevailing trend, offering insight into potential buying or selling opportunities.
Key Components
1. Returns Calculation:
* The indicator uses logarithmic returns (log(close / close[1])) to measure relative price changes in a normalized manner.
* Log returns are more effective than simple price differences when analyzing data across varying price levels, as they account for percentage-based changes.
2. Standard Deviation of Returns:
* The script computes the standard deviation of returns over a user-defined lookback period (ta.stdev(returns, lookback)).
* Standard deviation measures the dispersion of returns around their average, effectively quantifying market volatility.
* A higher standard deviation indicates increased volatility, while lower standard deviation reflects a calmer market.
3. Price Action:
* Detects higher highs (new peaks in price) and lower lows (new troughs in price) over the lookback period.
* Price trends are compared to the behavior of the standard deviation.
4. Divergence Detection:
A divergence occurs when price action (higher highs or lower lows) is not confirmed by a corresponding movement in standard deviation:
Bullish Divergence: Price makes a lower low, but the standard deviation does not, signaling potential upward momentum.
Bearish Divergence: Price makes a higher high, but the standard deviation does not, signaling potential downward momentum.
5. Visual Cues:
The script highlights divergence regions directly on the chart:
Green Background: Indicates a bullish divergence (potential buy signal).
Red Background: Indicates a bearish divergence (potential sell signal).
How It Works
Inputs:
* The user specifies the lookback period (lookback) for calculating the standard deviation and detecting divergences.
Calculation:
* Each bar’s returns are computed and used to calculate the standard deviation over the specified lookback period.
* The indicator evaluates price highs/lows and compares these with the highest and lowest values of the standard deviation within the same lookback period.
Highlight of Divergences:
When divergences are detected:
Bullish Divergence: The background of the chart is shaded green.
Bearish Divergence: The background of the chart is shaded red.
Trading Application
Bullish Divergence:
* Occurs when the market is oversold, or downward momentum is weakening.
* Suggests a potential reversal to an uptrend, signaling a buying opportunity.
Bearish Divergence:
* Occurs when the market is overbought, or upward momentum is weakening.
* Suggests a potential reversal to a downtrend, signaling a selling opportunity.
Contextual Use:
* Use this indicator in conjunction with other technical tools like RSI, MACD, or moving averages to confirm signals.
* Effective in volatile or ranging markets to help anticipate shifts in momentum.
Summary
The "Standard Deviation of Returns: Divergence" indicator is a robust tool for spotting divergences that can signal weakening market trends. It combines statistical volatility with price action analysis to highlight key areas of potential reversals. By integrating this tool into your trading strategy, you can gain additional confirmation for entries or exits while keeping a close watch on momentum shifts.
Disclaimer: This is not a financial advise; please consult your financial advisor for personalized advice.
오픈 소스 스크립트
트레이딩뷰의 진정한 정신에 따라, 이 스크립트의 작성자는 이를 오픈소스로 공개하여 트레이더들이 기능을 검토하고 검증할 수 있도록 했습니다. 작성자에게 찬사를 보냅니다! 이 코드는 무료로 사용할 수 있지만, 코드를 재게시하는 경우 하우스 룰이 적용된다는 점을 기억하세요.
면책사항
해당 정보와 게시물은 금융, 투자, 트레이딩 또는 기타 유형의 조언이나 권장 사항으로 간주되지 않으며, 트레이딩뷰에서 제공하거나 보증하는 것이 아닙니다. 자세한 내용은 이용 약관을 참조하세요.
오픈 소스 스크립트
트레이딩뷰의 진정한 정신에 따라, 이 스크립트의 작성자는 이를 오픈소스로 공개하여 트레이더들이 기능을 검토하고 검증할 수 있도록 했습니다. 작성자에게 찬사를 보냅니다! 이 코드는 무료로 사용할 수 있지만, 코드를 재게시하는 경우 하우스 룰이 적용된다는 점을 기억하세요.
면책사항
해당 정보와 게시물은 금융, 투자, 트레이딩 또는 기타 유형의 조언이나 권장 사항으로 간주되지 않으며, 트레이딩뷰에서 제공하거나 보증하는 것이 아닙니다. 자세한 내용은 이용 약관을 참조하세요.