OPEN-SOURCE SCRIPT
Volume-Weighted Price Levels (VWPL)
Introduction:
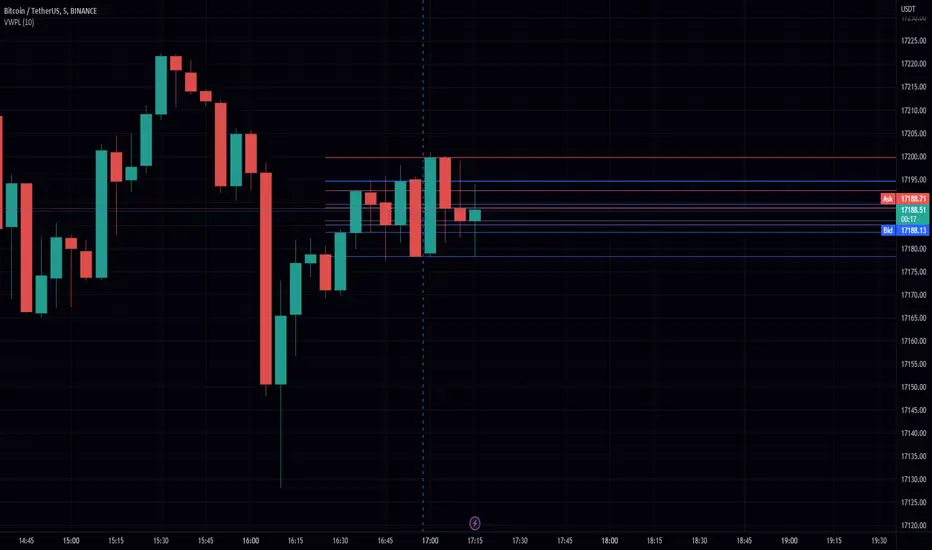
In this script, we will be creating an indicator that plots horizontal lines on the chart for each unique price in a given range, and colors them based on the volume of that price.
Explanation:
First, we define the input "Length" as an integer. This will determine the number of bars back from the current bar to include in the range.
We then create two arrays: "price" and "vol." The "price" array will store all the unique prices in the given range, and the "vol" array will store the corresponding volumes for those prices.
Using a for loop, we iterate through the range of bars and check if the current close price is already included in the "price" array. If it is not, we add it to the array and also add the corresponding volume to the "vol" array. If it is already included, we find the index of that price in the "price" array and add the current volume to the volume stored at that index in the "vol" array.
After the for loop, we find the maximum volume in the "vol" array and use that to find the corresponding price in the "price" array. This will be the price at which we draw the horizontal line.
We then create an array of lines called "lines" and, using another for loop, we iterate through the "price" array and add a line to the "lines" array for each price. The color of each line is determined by the volume of that price, using a color gradient from blue (lowest volume) to red (highest volume).
Finally, we use an if statement to check if the current bar is the last bar in the chart, and if it is, we use another for loop to iterate through the "lines" array and delete all the lines. This is to prevent the lines from being carried over to the next bar and potentially being plotted multiple times.
Conclusion:
This script can be useful for visualizing the price levels with the highest volume in a given range, as well as seeing how volume is distributed among different price levels. It can be helpful for identifying areas of significant buying or selling pressure.
오픈 소스 스크립트
트레이딩뷰의 진정한 정신에 따라, 이 스크립트의 작성자는 이를 오픈소스로 공개하여 트레이더들이 기능을 검토하고 검증할 수 있도록 했습니다. 작성자에게 찬사를 보냅니다! 이 코드는 무료로 사용할 수 있지만, 코드를 재게시하는 경우 하우스 룰이 적용된다는 점을 기억하세요.
면책사항
해당 정보와 게시물은 금융, 투자, 트레이딩 또는 기타 유형의 조언이나 권장 사항으로 간주되지 않으며, 트레이딩뷰에서 제공하거나 보증하는 것이 아닙니다. 자세한 내용은 이용 약관을 참조하세요.
오픈 소스 스크립트
트레이딩뷰의 진정한 정신에 따라, 이 스크립트의 작성자는 이를 오픈소스로 공개하여 트레이더들이 기능을 검토하고 검증할 수 있도록 했습니다. 작성자에게 찬사를 보냅니다! 이 코드는 무료로 사용할 수 있지만, 코드를 재게시하는 경우 하우스 룰이 적용된다는 점을 기억하세요.
면책사항
해당 정보와 게시물은 금융, 투자, 트레이딩 또는 기타 유형의 조언이나 권장 사항으로 간주되지 않으며, 트레이딩뷰에서 제공하거나 보증하는 것이 아닙니다. 자세한 내용은 이용 약관을 참조하세요.