OPEN-SOURCE SCRIPT
RSI Scanner
RSI Scanner
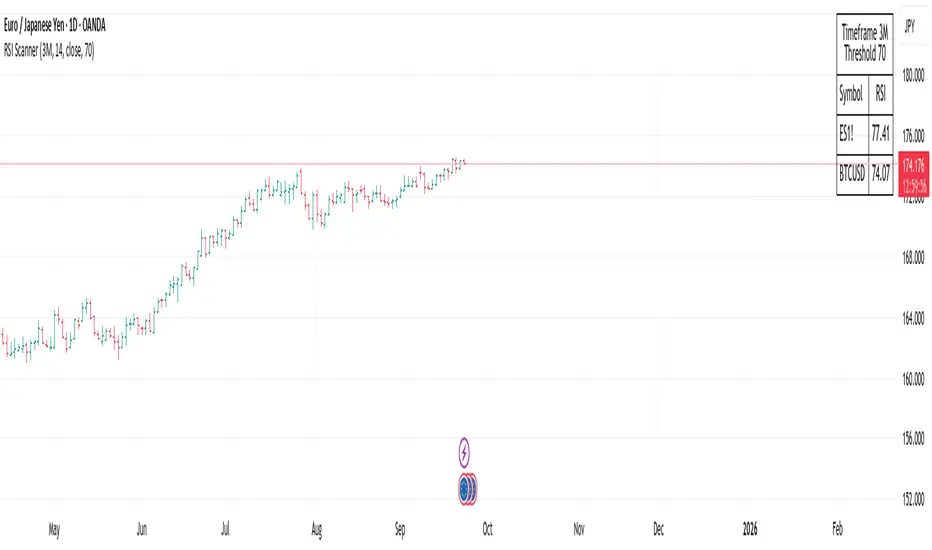
This script scans a custom list of symbols and displays their RSI values for a selected higher timeframe (default: 3M). It provides a quick way to monitor multiple markets in one place without switching charts.
Features:
How to use:
Use cases:
This script scans a custom list of symbols and displays their RSI values for a selected higher timeframe (default: 3M). It provides a quick way to monitor multiple markets in one place without switching charts.
Features:
- Customizable timeframe for RSI calculation (default: 3M).
- Adjustable RSI length and source input.
- Flexible filter: display all symbols or only those with RSI above a chosen threshold.
- Input your own list of symbols (stocks, forex, futures, crypto) via a text field.
- Results displayed in a clean, table directly on the chart.
- Automatic column split when the symbol list is long.
- Table header shows selected timeframe and filter settings for clarity.
How to use:
- Add the script to your chart.
- Open the Inputs panel.
- In Symbols List, enter the tickers you want to track, separated by commas (e.g. AAPL, TSLA, EURUSD, BTCUSD).
- Set the desired Timeframe (e.g. 3M, 1M, W).
- Adjust RSI Length and Source if needed.
- Enable or disable filtering:
If filtering is enabled, only symbols with RSI ≥ the threshold will be shown.
If disabled, all entered symbols will be displayed. - The table in the top-right corner will update automatically on the last bar.
Use cases:
- Monitor RSI across different asset classes on higher timeframes.
- Quickly spot overbought symbols (e.g. RSI > 70) without switching charts.
- Create a custom multi-market watchlist tailored to your strategy.
오픈 소스 스크립트
트레이딩뷰의 진정한 정신에 따라, 이 스크립트의 작성자는 이를 오픈소스로 공개하여 트레이더들이 기능을 검토하고 검증할 수 있도록 했습니다. 작성자에게 찬사를 보냅니다! 이 코드는 무료로 사용할 수 있지만, 코드를 재게시하는 경우 하우스 룰이 적용된다는 점을 기억하세요.
면책사항
해당 정보와 게시물은 금융, 투자, 트레이딩 또는 기타 유형의 조언이나 권장 사항으로 간주되지 않으며, 트레이딩뷰에서 제공하거나 보증하는 것이 아닙니다. 자세한 내용은 이용 약관을 참조하세요.
오픈 소스 스크립트
트레이딩뷰의 진정한 정신에 따라, 이 스크립트의 작성자는 이를 오픈소스로 공개하여 트레이더들이 기능을 검토하고 검증할 수 있도록 했습니다. 작성자에게 찬사를 보냅니다! 이 코드는 무료로 사용할 수 있지만, 코드를 재게시하는 경우 하우스 룰이 적용된다는 점을 기억하세요.
면책사항
해당 정보와 게시물은 금융, 투자, 트레이딩 또는 기타 유형의 조언이나 권장 사항으로 간주되지 않으며, 트레이딩뷰에서 제공하거나 보증하는 것이 아닙니다. 자세한 내용은 이용 약관을 참조하세요.