OPEN-SOURCE SCRIPT
Volume Surge Webhook Alert
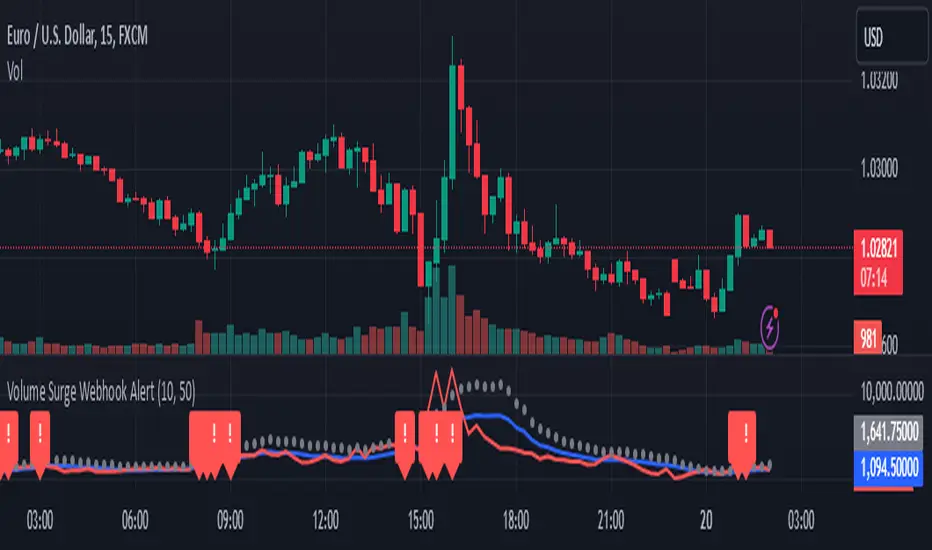
This TradingView indicator, named "Volume Surge Webhook Alert," is designed to find significant increases in trading volume and send out alerts with key information. It works by looking back at the volume over a certain number of past candlesticks, which you can set using the "Lookback Period" input. The indicator calculates the average volume during this period. Then, it sets a threshold for what counts as a "volume surge." This threshold is a percentage increase over the average volume, and you can adjust this percentage using the "Volume Surge Threshold (%)" input.
When the current candlestick's volume is higher than this threshold, the indicator considers it a volume surge. To help you see this visually, the indicator plots three lines on a separate chart: the average volume (in blue), the current volume (in red), and the threshold volume (in gray circles).
If a volume surge happens, the indicator creates a webhook alert. This alert sends a message in a structured format (like a digital envelope) that contains the following information: the symbol of the stock or cryptocurrency, the timeframe of the chart you're looking at, the current volume, the average volume, the threshold volume, and a simple message saying a volume surge was detected. This alert is sent only once when the candlestick closes with a volume surge.
Additionally, when a volume surge is detected, a small red exclamation mark "!" will appear above that candlestick on the main price chart.
Essentially, this indicator helps traders spot times when trading volume is unusually high, which can sometimes be a sign of important price movements. You can customize how sensitive the indicator is by changing the "Lookback Period" and the "Volume Surge Threshold (%)". The webhook alerts allow you to be notified automatically when these surges occur, so you don't have to constantly watch the charts.
오픈 소스 스크립트
트레이딩뷰의 진정한 정신에 따라, 이 스크립트의 작성자는 이를 오픈소스로 공개하여 트레이더들이 기능을 검토하고 검증할 수 있도록 했습니다. 작성자에게 찬사를 보냅니다! 이 코드는 무료로 사용할 수 있지만, 코드를 재게시하는 경우 하우스 룰이 적용된다는 점을 기억하세요.
면책사항
해당 정보와 게시물은 금융, 투자, 트레이딩 또는 기타 유형의 조언이나 권장 사항으로 간주되지 않으며, 트레이딩뷰에서 제공하거나 보증하는 것이 아닙니다. 자세한 내용은 이용 약관을 참조하세요.
오픈 소스 스크립트
트레이딩뷰의 진정한 정신에 따라, 이 스크립트의 작성자는 이를 오픈소스로 공개하여 트레이더들이 기능을 검토하고 검증할 수 있도록 했습니다. 작성자에게 찬사를 보냅니다! 이 코드는 무료로 사용할 수 있지만, 코드를 재게시하는 경우 하우스 룰이 적용된다는 점을 기억하세요.
면책사항
해당 정보와 게시물은 금융, 투자, 트레이딩 또는 기타 유형의 조언이나 권장 사항으로 간주되지 않으며, 트레이딩뷰에서 제공하거나 보증하는 것이 아닙니다. 자세한 내용은 이용 약관을 참조하세요.