OPEN-SOURCE SCRIPT
업데이트됨 MULTI TF SCANNER
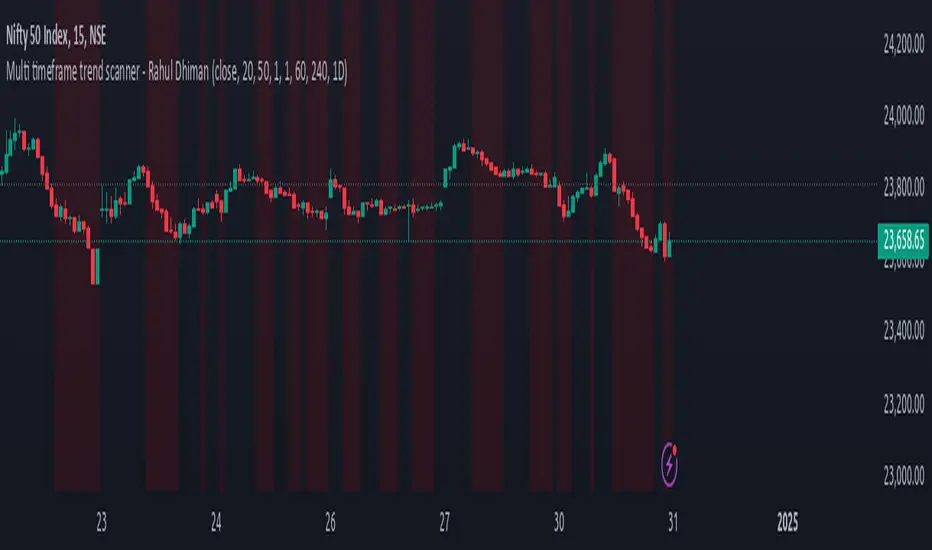
Multi-Timeframe Moving Average Scanner Script
This script is designed to scan multiple timeframes for specific moving average (MA) crossovers to help traders identify potential buy or sell signals. The moving averages, such as the Simple Moving Average (SMA) or Exponential Moving Average (EMA), are calculated for different timeframes, allowing the script to provide a comprehensive analysis of the market trend.
Features:
Multiple Timeframe Analysis:
The script scans across various timeframes, including 5 minutes, 15 minutes, 1 hour, 4 hours, 1 day, and 1 week.
The moving averages are calculated for each of these timeframes, enabling the trader to gauge trends across short, medium, and long-term periods.
MA Crossover Detection:
The script checks for crossovers between a fast-moving average (e.g., 9-period) and a slow-moving average (e.g., 50-period).
A bullish crossover (fast MA crossing above slow MA) signals a potential buy, while a bearish crossover (fast MA crossing below slow MA) signals a potential sell.
Recursive Timeframe Check:
Before generating a buy or sell signal, the script checks for confirmations from higher timeframes.
Signals are only generated when the crossovers align across multiple timeframes (e.g., a buy signal on the 5-minute chart is confirmed by a bullish crossover on the 1-hour and 4-hour charts).
Signal Quality Indicator:
The script assigns a quality score to each signal based on how many higher timeframes confirm the crossover.
A stronger confirmation across multiple timeframes increases the quality of the signal, which can be visualized on the chart.
Optimized for Performance:
The calculations for moving average crossovers are designed to minimize unnecessary recalculations, optimizing the script’s performance and reducing lag.
The multi-timeframe checks are done only when the moving average crossover occurs or changes, ensuring efficiency.
User-Friendly Interface:
The results are displayed on the chart with clear visual cues to indicate the buy/sell signals and signal strength.
The script is minimalistic, with an uncluttered interface, providing the user with only the most relevant information for making trading decisions.
릴리즈 노트
Update some optimization to existimg script릴리즈 노트
Upgrade to version 3 by adding atr stoploss릴리즈 노트
Multi Timeframe Trend Scanner by Rahul DhimanUpdate new version
오픈 소스 스크립트
트레이딩뷰의 진정한 정신에 따라, 이 스크립트의 작성자는 이를 오픈소스로 공개하여 트레이더들이 기능을 검토하고 검증할 수 있도록 했습니다. 작성자에게 찬사를 보냅니다! 이 코드는 무료로 사용할 수 있지만, 코드를 재게시하는 경우 하우스 룰이 적용된다는 점을 기억하세요.
면책사항
해당 정보와 게시물은 금융, 투자, 트레이딩 또는 기타 유형의 조언이나 권장 사항으로 간주되지 않으며, 트레이딩뷰에서 제공하거나 보증하는 것이 아닙니다. 자세한 내용은 이용 약관을 참조하세요.
오픈 소스 스크립트
트레이딩뷰의 진정한 정신에 따라, 이 스크립트의 작성자는 이를 오픈소스로 공개하여 트레이더들이 기능을 검토하고 검증할 수 있도록 했습니다. 작성자에게 찬사를 보냅니다! 이 코드는 무료로 사용할 수 있지만, 코드를 재게시하는 경우 하우스 룰이 적용된다는 점을 기억하세요.
면책사항
해당 정보와 게시물은 금융, 투자, 트레이딩 또는 기타 유형의 조언이나 권장 사항으로 간주되지 않으며, 트레이딩뷰에서 제공하거나 보증하는 것이 아닙니다. 자세한 내용은 이용 약관을 참조하세요.