OPEN-SOURCE SCRIPT
업데이트됨 Institutional Absorption
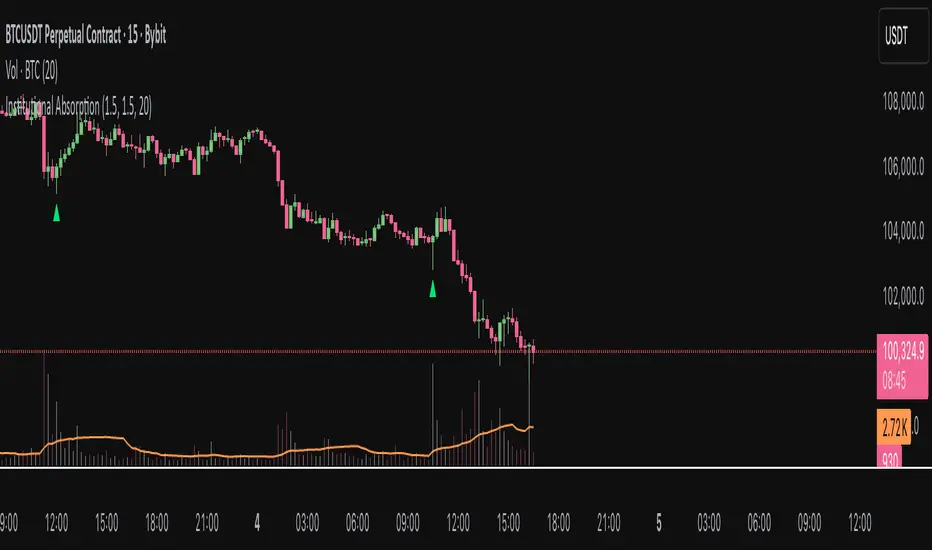
Highlights potential zones where institutional participants may be absorbing aggressive buying or selling pressure.
It analyzes candle structure and volume to detect possible bullish and bearish absorption events, providing a visual cue for traders studying market imbalance and liquidity dynamics.
The script compares each candle’s wick–body ratio and volume relative to its moving average.
A bullish absorption setup occurs when strong volume appears after a sharp downward move with long lower wicks, while bearish absorption occurs after upward moves with long upper wicks, suggesting the presence of large counter-orders.
+ Features
Detects bullish and bearish absorption candles.
Customizable wick to body ratio and volume multiple thresholds.
Optional filter to require candle color alignment with trend (green/red).
Option to ignore tiny body (doji-like) candles.
+ How to Use
Adjust wick–body ratio, volume multiplier, and lookback length under “Conditions (Absorption)”.
Enable “Require candle color” to strengthen directional context.
Use alerts to receive notifications when new absorption signals appear.
+ Notes
This tool aims to visualize possible absorption behavior, not confirm institutional activity.
Combine it with your broader market structure, volume, or order flow analysis for a more comprehensive analysis.
릴리즈 노트
Revision 1오픈 소스 스크립트
트레이딩뷰의 진정한 정신에 따라, 이 스크립트의 작성자는 이를 오픈소스로 공개하여 트레이더들이 기능을 검토하고 검증할 수 있도록 했습니다. 작성자에게 찬사를 보냅니다! 이 코드는 무료로 사용할 수 있지만, 코드를 재게시하는 경우 하우스 룰이 적용된다는 점을 기억하세요.
면책사항
해당 정보와 게시물은 금융, 투자, 트레이딩 또는 기타 유형의 조언이나 권장 사항으로 간주되지 않으며, 트레이딩뷰에서 제공하거나 보증하는 것이 아닙니다. 자세한 내용은 이용 약관을 참조하세요.
오픈 소스 스크립트
트레이딩뷰의 진정한 정신에 따라, 이 스크립트의 작성자는 이를 오픈소스로 공개하여 트레이더들이 기능을 검토하고 검증할 수 있도록 했습니다. 작성자에게 찬사를 보냅니다! 이 코드는 무료로 사용할 수 있지만, 코드를 재게시하는 경우 하우스 룰이 적용된다는 점을 기억하세요.
면책사항
해당 정보와 게시물은 금융, 투자, 트레이딩 또는 기타 유형의 조언이나 권장 사항으로 간주되지 않으며, 트레이딩뷰에서 제공하거나 보증하는 것이 아닙니다. 자세한 내용은 이용 약관을 참조하세요.