OPEN-SOURCE SCRIPT
업데이트됨 ABO LANA-𝑀
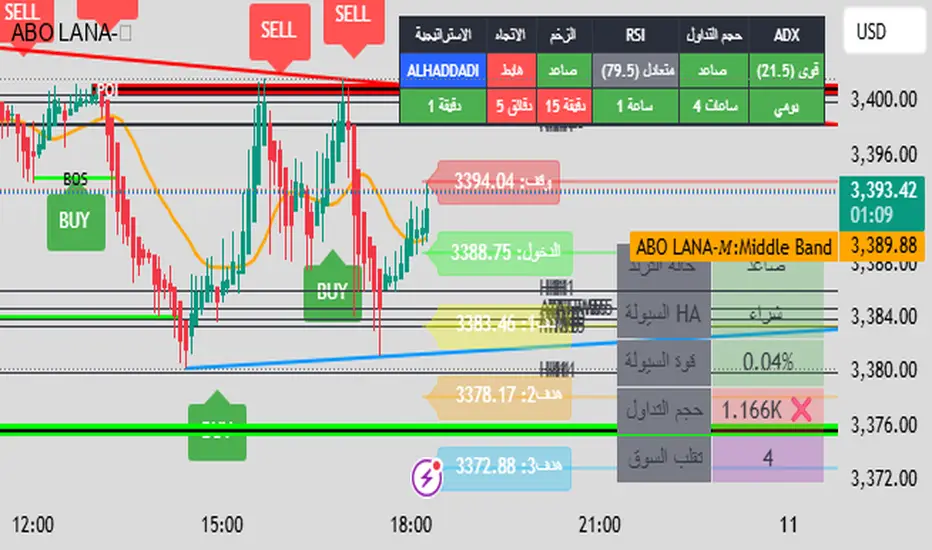
1. إشارات التداول الرئيسية:
إشارة شراء (BUY):
تظهر عند تحول اتجاه السوق من هابط إلى صاعد، مع إغلاق السعر فوق المتوسط المتحرك (EMA 9).
إشارة بيع (SELL):
تظهر عند تحول الاتجاه من صاعد إلى هابط، مع إغلاق السعر تحت المتوسط المتحرك.
2. مناطق العرض والطلب (Supply/Demand):
مناطق العرض (Supply):
تمثل مستويات مقاومة رئيسية (لون أحمر) تُرسم عند القمم السعرية.
مناطق الطلب (Demand):
تمثل مستويات دعم رئيسية (لون أخضر) تُرسم عند القيعان السعرية.
تحديث تلقائي بناءً على حركة السعر وأطر زمنية متعددة.
3. إدارة المخاطر والأرباح:
وقف الخسارة (SL):
يُحسب باستخدام مضاعف ATR (المدى الحقيقي).
مستويات الأرباح (TP1, TP2, TP3):
مستويات ثلاثية للأرباح مع مضاعفات قابلة للتخصيص.
تنبيهات صوتية عند تحقيق كل هدف.
4. لوحة المعلومات (Dashboard):
اتجاه السوق: صاعد/هابط عبر 6 أطر زمنية (من 1 دقيقة إلى يومي).
مؤشر الزخم (Momentum):
اتجاه حركة السعر خلال 10 شمعات.
RSI مخصص:
يجمع بين RSI قصير المدى (2) ومتوسط متحرك (7).
حجم التداول: صاعد/هابط مقارنة بالمتوسط.
قوة الترند (ADX): قوي/ضعيف.
5. ميزات إضافية:
خطوط اتجاه ديناميكية:
تُرسم تلقائياً بين القمم والقيعان.
مستويات دعم/مقاومة:
مستخرجة من 7 أطر زمنية (H4, H1, M30, ...).
نطاق متوسط (Middle Band):
خط برتقالي يعكس متوسط حركة السعر.
تحليل السيولة:
يعتمد على شموع هايكين أشي وحجم التداول.
Brief Explanation of ABO LANA-M (English):
1. Core Trading Signals:
BUY Signal:
Triggers when market trend shifts from bearish to bullish, with price closing above EMA 9.
SELL Signal:
Activates when trend reverses from bullish to bearish, with price closing below EMA 9.
2. Supply/Demand Zones:
Supply Zones (Red):
Key resistance levels plotted at swing highs.
Demand Zones (Green):
Key support levels plotted at swing lows.
Auto-updated based on price action across multiple timeframes.
3. Risk & Profit Management:
Stop Loss (SL):
Calculated using ATR multiplier.
Take Profit Targets (TP1, TP2, TP3):
Three customizable profit levels.
Audio alerts when each target is hit.
4. Smart Dashboard:
Market Trend: Bullish/Bearish across 6 timeframes (1m to Daily).
Momentum Indicator:
Price movement direction over 10 candles.
Custom RSI:
Combines RSI(2) with SMA(7) for smoother readings.
Volume Analysis:
Compares current volume to 20-period average.
Trend Strength (ADX): Strong/Weak.
5. Advanced Features:
Dynamic Trendlines:
Automatically drawn between swing highs/lows.
Support/Resistance Levels:
Extracted from 7 timeframes (H4, H1, M30, etc.).
Middle Band:
Orange line showing price equilibrium.
Liquidity Analysis:
Based on Heikin Ashi candles and volume confirmation.
릴리즈 노트
M오픈 소스 스크립트
트레이딩뷰의 진정한 정신에 따라, 이 스크립트의 작성자는 이를 오픈소스로 공개하여 트레이더들이 기능을 검토하고 검증할 수 있도록 했습니다. 작성자에게 찬사를 보냅니다! 이 코드는 무료로 사용할 수 있지만, 코드를 재게시하는 경우 하우스 룰이 적용된다는 점을 기억하세요.
면책사항
해당 정보와 게시물은 금융, 투자, 트레이딩 또는 기타 유형의 조언이나 권장 사항으로 간주되지 않으며, 트레이딩뷰에서 제공하거나 보증하는 것이 아닙니다. 자세한 내용은 이용 약관을 참조하세요.
오픈 소스 스크립트
트레이딩뷰의 진정한 정신에 따라, 이 스크립트의 작성자는 이를 오픈소스로 공개하여 트레이더들이 기능을 검토하고 검증할 수 있도록 했습니다. 작성자에게 찬사를 보냅니다! 이 코드는 무료로 사용할 수 있지만, 코드를 재게시하는 경우 하우스 룰이 적용된다는 점을 기억하세요.
면책사항
해당 정보와 게시물은 금융, 투자, 트레이딩 또는 기타 유형의 조언이나 권장 사항으로 간주되지 않으며, 트레이딩뷰에서 제공하거나 보증하는 것이 아닙니다. 자세한 내용은 이용 약관을 참조하세요.