PROTECTED SOURCE SCRIPT
업데이트됨 Medium-Term Valuation | MiesOnCharts
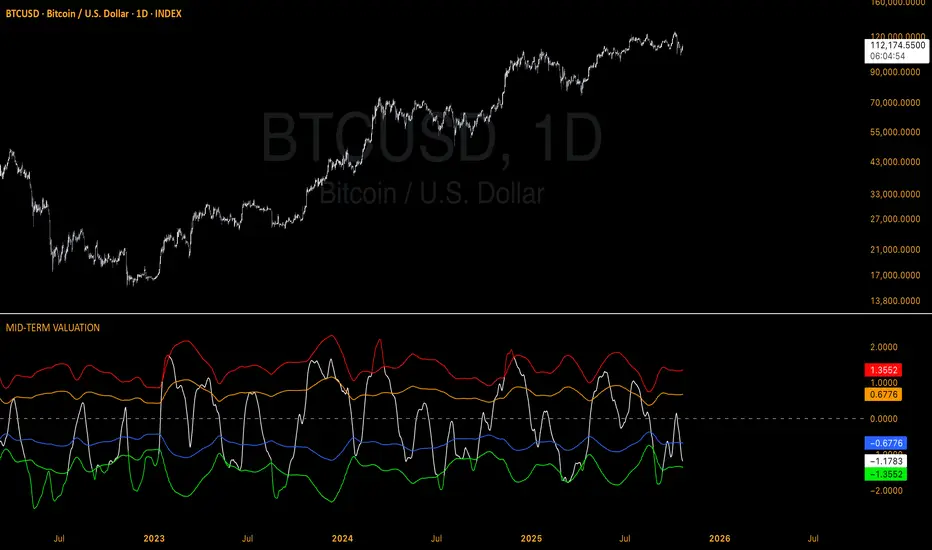
This medium-term valuation indicator integrates multiple valuation metrics to assist investors in identifying oversold and overbought market conditions with greater precision.
How to Interpret:
The indicator employs adaptive standard deviation bands to define extreme market zones. The red band signals a strongly overbought condition, while the green band indicates a significantly oversold condition.
How to Apply:
Investors can leverage these extreme levels as strategic points for taking profits or implementing dollar-cost averaging (DCA) strategies, optimizing entry and exit decisions in the market.
Disclaimer: NOT Financial advice. Past performance is not indicative of future results. No trading strategy can guarantee success in financial markets.
릴리즈 노트
/보호된 스크립트입니다
이 스크립트는 비공개 소스로 게시됩니다. 하지만 제한 없이 자유롭게 사용할 수 있습니다 — 여기에서 자세히 알아보기.
면책사항
이 정보와 게시물은 TradingView에서 제공하거나 보증하는 금융, 투자, 거래 또는 기타 유형의 조언이나 권고 사항을 의미하거나 구성하지 않습니다. 자세한 내용은 이용 약관을 참고하세요.
보호된 스크립트입니다
이 스크립트는 비공개 소스로 게시됩니다. 하지만 제한 없이 자유롭게 사용할 수 있습니다 — 여기에서 자세히 알아보기.
면책사항
이 정보와 게시물은 TradingView에서 제공하거나 보증하는 금융, 투자, 거래 또는 기타 유형의 조언이나 권고 사항을 의미하거나 구성하지 않습니다. 자세한 내용은 이용 약관을 참고하세요.