OPEN-SOURCE SCRIPT
업데이트됨 Trend Flow Oscillator (CMF + MFI) + ADX
## Trend Flow Oscillator (TFO + ADX) Indicator Description
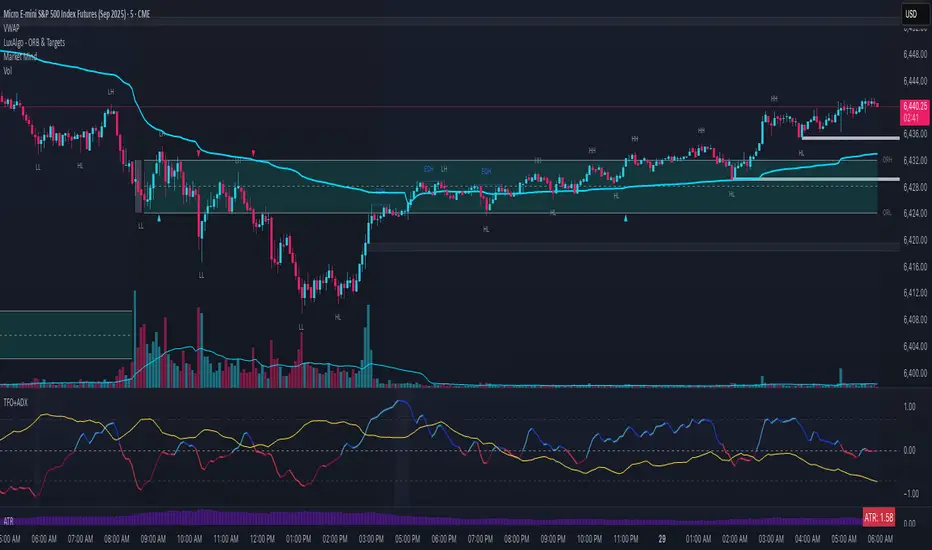
The Trend Flow Oscillator (TFO+ADX) combines two volume-based indicators, Money Flow Index (MFI) and Chaikin Money Flow (CMF), along with the Average Directional Index (ADX) into one comprehensive oscillator. This indicator provides traders with insights into momentum, volume flow, and trend strength, clearly indicating bullish or bearish market conditions.
### How the Indicator Works:
1. **Money Flow Index (MFI)**:
* Measures buying and selling pressure based on price and volume.
* Scaled from -1 to +1 (where positive values indicate buying pressure, negative values indicate selling pressure).
2. **Chaikin Money Flow (CMF)**:
* Evaluates money flow volume over a set period, reflecting institutional buying or selling.
* Also scaled from -1 to +1 (positive values suggest bullish accumulation, negative values bearish distribution).
3. **Average Directional Index (ADX)**:
* Measures trend strength, indicating whether a market is trending or ranging.
* Scaled from -1 to +1, with values above 0 suggesting strong trends, and values near or below 0 indicating weak trends or sideways markets.
* Specifically, an ADX value of 0 means neutral trend strength; positive values indicate a strong trend.
### Indicator Levels and Interpretation:
* **Zero Line (0)**: Indicates neutral conditions. When the oscillator crosses above zero, it signals increasing bullish momentum; crossing below zero indicates bearish momentum.
* **Extreme Zones (+/- 0.75)**:
* Oscillator values above +0.75 are considered overbought or highly bullish.
* Oscillator values below -0.75 are considered oversold or highly bearish.
* The indicator features subtle background shading to visually highlight these extreme momentum areas for quick identification.
* Shading when values above or below the +/-1.0 level.
* **Color Coding**:
* Bright blue indicates strengthening bullish momentum.
* Dark blue signals weakening bullish momentum.
* Bright red indicates strengthening bearish momentum.
* Dark maroon signals weakening bearish momentum.
릴리즈 노트
// UPDATE: This indicator has been replaced//I've significantly simplified and improved this concept. The "Pro" version became overly complex with features that didn't add real value.
//Check out the new Flow Control Oscillator (FCO) instead:
//

//The FCO keeps what worked (MFI + CMF + ADX weighting) and removes the unnecessary complexity. Cleaner, more reliable signals for intraday trading.
오픈 소스 스크립트
트레이딩뷰의 진정한 정신에 따라, 이 스크립트의 작성자는 이를 오픈소스로 공개하여 트레이더들이 기능을 검토하고 검증할 수 있도록 했습니다. 작성자에게 찬사를 보냅니다! 이 코드는 무료로 사용할 수 있지만, 코드를 재게시하는 경우 하우스 룰이 적용된다는 점을 기억하세요.
면책사항
해당 정보와 게시물은 금융, 투자, 트레이딩 또는 기타 유형의 조언이나 권장 사항으로 간주되지 않으며, 트레이딩뷰에서 제공하거나 보증하는 것이 아닙니다. 자세한 내용은 이용 약관을 참조하세요.
오픈 소스 스크립트
트레이딩뷰의 진정한 정신에 따라, 이 스크립트의 작성자는 이를 오픈소스로 공개하여 트레이더들이 기능을 검토하고 검증할 수 있도록 했습니다. 작성자에게 찬사를 보냅니다! 이 코드는 무료로 사용할 수 있지만, 코드를 재게시하는 경우 하우스 룰이 적용된다는 점을 기억하세요.
면책사항
해당 정보와 게시물은 금융, 투자, 트레이딩 또는 기타 유형의 조언이나 권장 사항으로 간주되지 않으며, 트레이딩뷰에서 제공하거나 보증하는 것이 아닙니다. 자세한 내용은 이용 약관을 참조하세요.