PROTECTED SOURCE SCRIPT
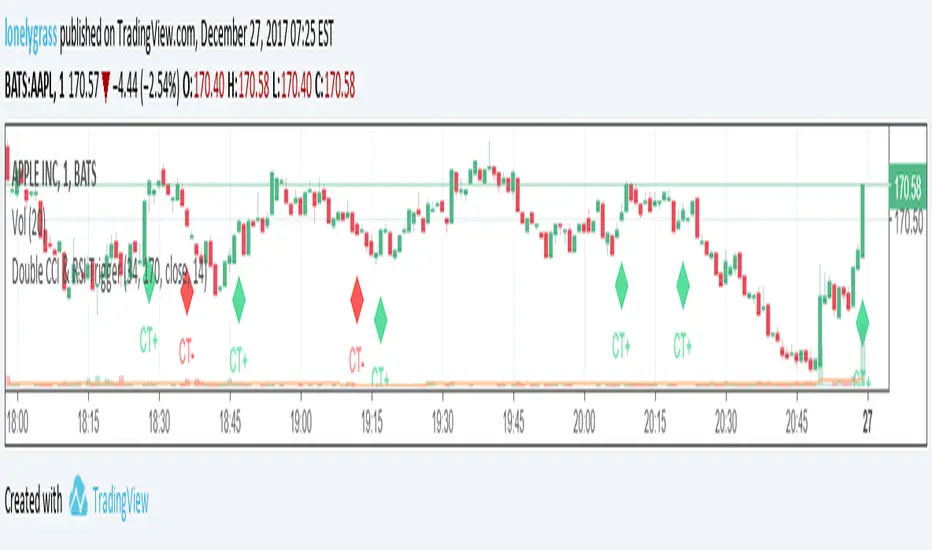
Double CCI & RSI Trigger
Warning : This strategy can only be implemented with 1 minute timeframe chart
With the help of 2 CCI and 1 RSI, it is much easier to identify the market trend. The main idea of this EA is looking at a longer CCI (170 periods) and RSI (14 periods) and finding some possible bullish and bearish trends.
Bullish Conditions: 170 CCI has a value of above 0 and RSI 14 is larger than 30 (oversold)
Bearish Conditions: 170 CCI has a value of below 0 and RSI 14 is lower than 70 (overbought)
When conditions are met, CT+ (bullish) and CT- (bearish) signals will be shown on the graph.
To effectively adopt the system, users have to incorporate "Double CCI & RSI Alert" , my another script, into this and can decide whether or not to hold onto positions. Happy trading! Appreciate support and comments!
보호된 스크립트입니다
이 스크립트는 비공개 소스로 게시됩니다. 하지만 이를 자유롭게 제한 없이 사용할 수 있습니다 – 자세한 내용은 여기에서 확인하세요.
면책사항
해당 정보와 게시물은 금융, 투자, 트레이딩 또는 기타 유형의 조언이나 권장 사항으로 간주되지 않으며, 트레이딩뷰에서 제공하거나 보증하는 것이 아닙니다. 자세한 내용은 이용 약관을 참조하세요.
보호된 스크립트입니다
이 스크립트는 비공개 소스로 게시됩니다. 하지만 이를 자유롭게 제한 없이 사용할 수 있습니다 – 자세한 내용은 여기에서 확인하세요.
면책사항
해당 정보와 게시물은 금융, 투자, 트레이딩 또는 기타 유형의 조언이나 권장 사항으로 간주되지 않으며, 트레이딩뷰에서 제공하거나 보증하는 것이 아닙니다. 자세한 내용은 이용 약관을 참조하세요.