OPEN-SOURCE SCRIPT
Multi-SMA Dashboard (10 SMAs)
Description:
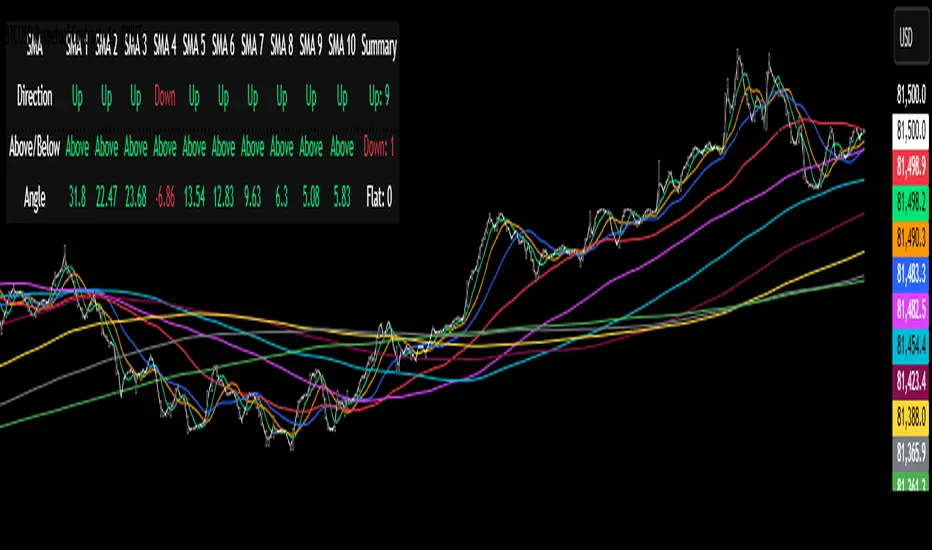
This script, "Multi-SMA Dashboard (10 SMAs)," creates a dashboard on a TradingView chart to analyze ten Simple Moving Averages (SMAs) of varying lengths. It overlays the chart and displays a table with each SMA’s direction, price position relative to the SMA, and angle of movement, providing a comprehensive trend overview.
How It Works:
1. **Inputs**: Users define lengths for 10 SMAs (default: 5, 10, 20, 50, 100, 150, 200, 250, 300, 350), select a price source (default: close), and customize table appearance and options like angle units (degrees/radians) and debug plots.
2. **SMA Calculation**: Computes 10 SMAs using the `ta.sma()` function with user-specified lengths and price source.
3. **Direction Determination**: The `sma_direction()` function checks each SMA’s trend:
- "Up" if current SMA > previous SMA.
- "Down" if current SMA < previous SMA.
- "Flat" if equal (no strength distinction).
4. **Price Position**: Compares the price source to each SMA, labeling it "Above" or "Below."
5. **Angle Calculation**: Tracks the most recent direction change point for each SMA and calculates its angle (atan of price change over time) in degrees or radians, based on the `showInRadians` toggle.
6. **Table Display**: A 12-column table shows:
- Columns 1-10: SMA name, direction (Up/Down/Flat), Above/Below status, and angle.
- Column 11: Summary of Up, Down, and Flat counts.
- Colors reflect direction (lime for Up/Above, red for Down/Below, white for Flat).
7. **Debug Option**: Optionally plots all SMAs and price for visual verification when `debug_plots_toggle` is enabled.
Indicators Used:
- Simple Moving Averages (SMAs): 10 user-configurable SMAs ranging from short-term (e.g., 5) to long-term (e.g., 350) periods.
The script runs continuously, updating the table on each bar, and overlays the chart to assist traders in assessing multi-timeframe trend direction and momentum without cluttering the view unless debug mode is active.
오픈 소스 스크립트
트레이딩뷰의 진정한 정신에 따라, 이 스크립트의 작성자는 이를 오픈소스로 공개하여 트레이더들이 기능을 검토하고 검증할 수 있도록 했습니다. 작성자에게 찬사를 보냅니다! 이 코드는 무료로 사용할 수 있지만, 코드를 재게시하는 경우 하우스 룰이 적용된다는 점을 기억하세요.
면책사항
해당 정보와 게시물은 금융, 투자, 트레이딩 또는 기타 유형의 조언이나 권장 사항으로 간주되지 않으며, 트레이딩뷰에서 제공하거나 보증하는 것이 아닙니다. 자세한 내용은 이용 약관을 참조하세요.
오픈 소스 스크립트
트레이딩뷰의 진정한 정신에 따라, 이 스크립트의 작성자는 이를 오픈소스로 공개하여 트레이더들이 기능을 검토하고 검증할 수 있도록 했습니다. 작성자에게 찬사를 보냅니다! 이 코드는 무료로 사용할 수 있지만, 코드를 재게시하는 경우 하우스 룰이 적용된다는 점을 기억하세요.
면책사항
해당 정보와 게시물은 금융, 투자, 트레이딩 또는 기타 유형의 조언이나 권장 사항으로 간주되지 않으며, 트레이딩뷰에서 제공하거나 보증하는 것이 아닙니다. 자세한 내용은 이용 약관을 참조하세요.