OPEN-SOURCE SCRIPT
Price-Action Candles (Lower)
What is a swing high or swing low?
Swing highs and lows are price extremes. For example say we set our swing length to 5. A candle that is a swing high with a swing length of 5 will have 5 bars to the left that are lower and 5 bars to the right that are lower. A candle that is a swing low with a swing length of 5 will have 5 bars to the left that are higher and 5 bars to the right that are higher.
How is the trend coloring calculated?
The trend coloring is calculated the exact same way as our trend candles study...https://www.tradingview.com/script/V9T81uWb-Price-Action-Candles/by storing and comparing historical swing lows and swing highs.
The pinescript code goes as follows:
Pine Script®
What does that gibberish mean?
-Trend can be GREEN IF
- We have a higher high (current swing high is greater than the previous swing high) and the high is greater than the previous swing high
- OR The current close is greater than the current swing high
-Trend can be RED IF
- We have a lower low (current swing low is less than the previous swing low) and the low is less than the previous swing low
- OR The current close is less than the current swing low
-Trend can be YELLOW IF
- We have a new swing high and the new swing high is less than the previous swing high
- OR We have a new swing low and the new swing low is greater than the previous swing low
If none of the conditions above are true then we continue with whatever color the previous bar was.
What is repainting?
Repainting is "script behavior causing historical vs realtime calculations or plots to behave differently." That definition comes directly from Tradingview. If you want to read the full explanation you can visit it here https://www.tradingview.com/pine-script-docs/en/v5/concepts/Repainting.html#future-leak-with-request-security . The price-action candles use swing highs and swing lows which need bars to the left (past) and bars to the right ("future") in order to confirm the swing level. Because of the need to wait for confirmation for swing levels the plot style can be repainting. The Price-Action Candles (Lower) indicator, or this indicator, has no repainting anywhere. We opt to not shift back the candle coloring which causes the repainting, but it is relevant to discuss since this indicator's sibling (Price-Action Candles) can have repainting labels.
Repaint
Here the labels are shifted back the price-action length. Repainting is not present in the Price-Candles (Lower) study, but can be found in this indicator's sibling (Price-Action Candles).

Non-Repaint
Here the labels are not shifted back or "repainted". Repainting is not present in the Price-Candles (Lower) study, but can be found in this indicator's sibling (Price-Action Candles).

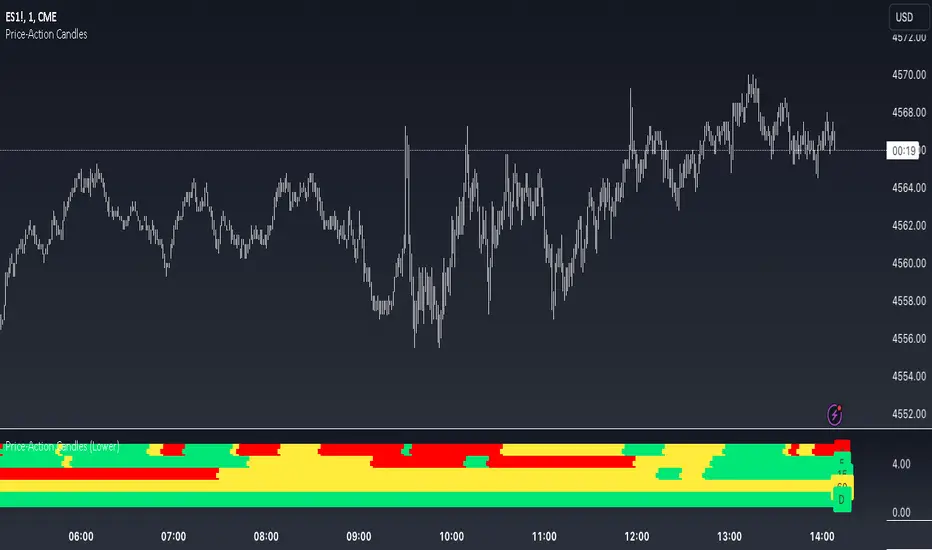
Multi-timeframe Analysis
The users can view multi-timeframe historical price action trend via this lower study. Each timeframe is plotted as its own on the lower pane and you can determine what timeframe it is by the label next to the plot.
More examples


Pair the Price-Action Candles (Lower) indicator with our main price indicator that colors candles based on trend and can show price action labels.
https://www.tradingview.com/script/V9T81uWb-Price-Action-Candles/
Swing highs and lows are price extremes. For example say we set our swing length to 5. A candle that is a swing high with a swing length of 5 will have 5 bars to the left that are lower and 5 bars to the right that are lower. A candle that is a swing low with a swing length of 5 will have 5 bars to the left that are higher and 5 bars to the right that are higher.
How is the trend coloring calculated?
The trend coloring is calculated the exact same way as our trend candles study...https://www.tradingview.com/script/V9T81uWb-Price-Action-Candles/by storing and comparing historical swing lows and swing highs.
The pinescript code goes as follows:
The pinescript code goes as follows:
var int trend = na
trend := ((hh and high >= psh) or close > csh) ? 1 : ((ll and low <= psl) or close < csl) ? -1 : lh or hl ? 0 : trend[1]
What does that gibberish mean?
-Trend can be GREEN IF
- We have a higher high (current swing high is greater than the previous swing high) and the high is greater than the previous swing high
- OR The current close is greater than the current swing high
-Trend can be RED IF
- We have a lower low (current swing low is less than the previous swing low) and the low is less than the previous swing low
- OR The current close is less than the current swing low
-Trend can be YELLOW IF
- We have a new swing high and the new swing high is less than the previous swing high
- OR We have a new swing low and the new swing low is greater than the previous swing low
If none of the conditions above are true then we continue with whatever color the previous bar was.
What is repainting?
Repainting is "script behavior causing historical vs realtime calculations or plots to behave differently." That definition comes directly from Tradingview. If you want to read the full explanation you can visit it here https://www.tradingview.com/pine-script-docs/en/v5/concepts/Repainting.html#future-leak-with-request-security . The price-action candles use swing highs and swing lows which need bars to the left (past) and bars to the right ("future") in order to confirm the swing level. Because of the need to wait for confirmation for swing levels the plot style can be repainting. The Price-Action Candles (Lower) indicator, or this indicator, has no repainting anywhere. We opt to not shift back the candle coloring which causes the repainting, but it is relevant to discuss since this indicator's sibling (Price-Action Candles) can have repainting labels.
Repaint
Here the labels are shifted back the price-action length. Repainting is not present in the Price-Candles (Lower) study, but can be found in this indicator's sibling (Price-Action Candles).
Non-Repaint
Here the labels are not shifted back or "repainted". Repainting is not present in the Price-Candles (Lower) study, but can be found in this indicator's sibling (Price-Action Candles).
Multi-timeframe Analysis
The users can view multi-timeframe historical price action trend via this lower study. Each timeframe is plotted as its own on the lower pane and you can determine what timeframe it is by the label next to the plot.
More examples
Pair the Price-Action Candles (Lower) indicator with our main price indicator that colors candles based on trend and can show price action labels.
https://www.tradingview.com/script/V9T81uWb-Price-Action-Candles/
오픈 소스 스크립트
트레이딩뷰의 진정한 정신에 따라, 이 스크립트의 작성자는 이를 오픈소스로 공개하여 트레이더들이 기능을 검토하고 검증할 수 있도록 했습니다. 작성자에게 찬사를 보냅니다! 이 코드는 무료로 사용할 수 있지만, 코드를 재게시하는 경우 하우스 룰이 적용된다는 점을 기억하세요.
면책사항
해당 정보와 게시물은 금융, 투자, 트레이딩 또는 기타 유형의 조언이나 권장 사항으로 간주되지 않으며, 트레이딩뷰에서 제공하거나 보증하는 것이 아닙니다. 자세한 내용은 이용 약관을 참조하세요.
오픈 소스 스크립트
트레이딩뷰의 진정한 정신에 따라, 이 스크립트의 작성자는 이를 오픈소스로 공개하여 트레이더들이 기능을 검토하고 검증할 수 있도록 했습니다. 작성자에게 찬사를 보냅니다! 이 코드는 무료로 사용할 수 있지만, 코드를 재게시하는 경우 하우스 룰이 적용된다는 점을 기억하세요.
면책사항
해당 정보와 게시물은 금융, 투자, 트레이딩 또는 기타 유형의 조언이나 권장 사항으로 간주되지 않으며, 트레이딩뷰에서 제공하거나 보증하는 것이 아닙니다. 자세한 내용은 이용 약관을 참조하세요.